North American Freight Market Insights
Drive your business forward with timely information on freight trends and insights on supply and demand influencers.
To deliver our market insights to our global audiences in the timeliest manner possible, we rely on machine translations to translate these insights from English.
Updated on August 17, 2023
The following information is built on market data from public sources and C.H. Robinson’s information advantage—based on our experience, data, and scale. Use these insights to stay informed, make decisions designed to mitigate your risk, and avoid disruptions to your supply chain.
Customize and download this report
Explore all market insights
- North American Freight Market Insights
- Global Freight Market Insights
- North American Trade & Tariff Insights
Transportation Market Overview and Freight Trends
TOP STORY: Temperature controlled truckload forecasts follow dry van plus a premium
The temperature controlled truckload market is a subset of the larger truckload market that includes dry van, temperature controlled (reefer or refrigerated), flat bed, and tanker. Dedicated services are also a segment of the for-hire truckload market –they are skewed to dry van services, but temperature controlled services are also available. The dedicated services segment is influenced by similar forces as the broader temperature controlled market but brings two additional market influencers: fresh produce season and the need to provide protection from freezing for some products in cold weather seasons.
Below we offer some introductory insights into the shape of the temperature controlled truckload market, leaning into our spot market cost per mile forecast (published later in the truckload section of this report).
Market capacity top line
Perfect segmentation is difficult to offer, though temperature controlled is roughly 15% of the for-hire truckload market.
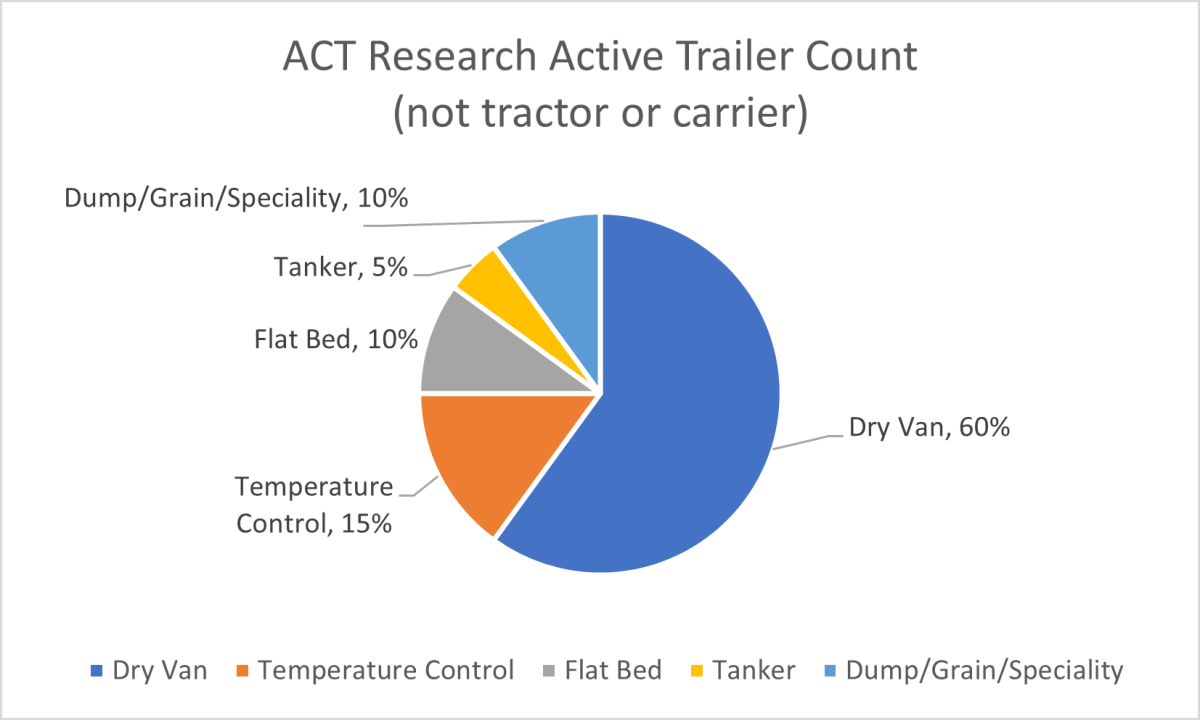
ASource: ACT Research active trailer count USA 2022
As shown above, temperature controlled capacity is materially smaller than dry van. Its top end capacity providers are made of fleets in the 400-3,999 size segment, with only 2 carriers at or crossing the threshold of 4,000+ tractors pulling refrigerated trailers. The bulk of the temperature controlled market is much like the broader market, heavily dependent on smaller fleet carriers.
Temperature service categories
The temperature control capacity community serves a portfolio of goods that require different temperature classes.
| Service | Temp range | Insights |
|---|---|---|
| Deep Freeze | Less than -14° F | Ideal for specific pharmaceutical products that require extreme cold to remain viable. This is a rather specialized and small refrigerated truckload equipment pool. |
| Frozen | -13° to 14° F | Ideal for a variety of products from ice cream to pizza, this range prevents thawing. |
| Refrigerated | 25° to 46° F | Ideal for food items like fresh produce, meat, and juice as well as other highly sensitive items, such as live vaccines. This temperature range keeps items cool without crossing into the frozen range. |
| Ambient | 59° to 77° F | Ideal for products that can't get too hot or cold. This range is about maintaining a constant temperature. |
Carriers in the temperature controlled market tend not to serve all four temperature segments. They may serve one to three, with most serving one or two only. Some categories, like refrigerated foods, have very specific restrictions for odor and cleanliness with low tolerances. As such, carriers moving refrigerated goods outside of the foods sectors tend to have limited participation in food shipments. This segmentation further limits the elasticity of the refrigerated capacity market and contributes to some of the increased pressure experienced during the fresh produce harvest seasons.
The interaction of van and refrigerated market capacity
Some refrigerated carriers turn off their refrigeration units during slower seasons for refrigerated freight and offer their services to the dry van freight shipper community. During this period, the van capacity is effectively increased. When produce season returns, the impact to the dry van spot market available capacity is often noticeable in growing/harvesting regions. As refrigerated demand increases and carriers pursue fresh produce loads, capacity available for dry van loads is lessened and dry van load to truck ratios increase and follow the growing season across the country.
Premium over van attributes
Refrigerated transportation premium is evident in our forecast highlighted later in this report. For simplicity it is often cited as roughly 20% over dry van. Refrigerated premium over dry van will vary by market (higher and lower). Displayed later in this report is our forecast. It is a national average cost per mile extension of DAT's Freightview broker to carrier cost per mile, without fuel.
- Seasonality of fresh produce season and the market origins tends to create additional deadhead/repositioning miles and cost
- Inherent risk due to freight characteristics and high rejection/claims ratio for temperature controlled products where failures influence quality and spoilage of sensitive products
- Cost to operate tends to be higher for reefer equipment starting with a higher price point for trailers, additional maintenance on refrigerated units, and refrigerated fuel that is not fully passed through. Truck drivers for refrigerated transportation often are paid higher than van drivers due to the extra work and liability of managing the reefer unit and trailer temperature.
Our first public release of the C.H. Robinson spot market refrigerated truckload cost to mile forecast has been added to our van forecast later in the TL section of the report. This is a blended forecast of temperature classes and an extension of DAT Rateview's broker to carrier cost per mile without fuel. As with our truckload forecast, this is a national average. Pricing will vary by lane, by temperature class, and freight/load attributes.

Market Insights Live! Ways to Win in Today’s Market
Tune in for new ways to leverage today’s softer market, and strategies to prepare for the next shift.
Get the latest market updates delivered to your inbox
Full Truckload Shipping
TOP STORY: The dog days of summer trucking
The summer trucking market continues to bounce along the bottom. It offers plentiful capacity and pricing that is not only challenging to the profitability and longevity of spot market carriers, but also to contract capacity carriers. Increasingly, carriers are citing pricing pressure and sporadic award volumes. The FMCSA continues to report some loss of carrier operating authority (albeit at a rate that is keeping the market over supplied) and small and medium fleet carriers are citing intentional contraction of their fleets to stay aligned with volumes. The national van carriers in Q1 reported 1.6% contraction in their active fleets. Since then they have been reporting continued efforts to contract the irregular route for hire capacity with focus on dedicated capacity for growth.
What follows in this section is our insights to the spot and contract markets, as well at C.H. Robinson cost per mile forecast for the spot market for both the dry van and temperature control segments.
Dry van is the largest segment of the truckload market. It is often the primary reference for the U.S. truckload market’s performance. For context, the dry van spot market has followed the somewhat normal seasonal tightening before the American Independence Day holiday on July 4, then was followed by normal seasonal softening post-holiday. Load to truck ratios (LTR) are still below the five-year averages of ~4:1, but are more balanced than they have been for some time.
The week 26 bump up leading to the 4th of July holiday in the USA settled back in weeks 27-29. Weeks 29-30 were slightly up, and following seasonal patterns weekly, both the 5-year average and the week 32 LTR dipped from previous weeks at 3.8 and 2.6 respectively.
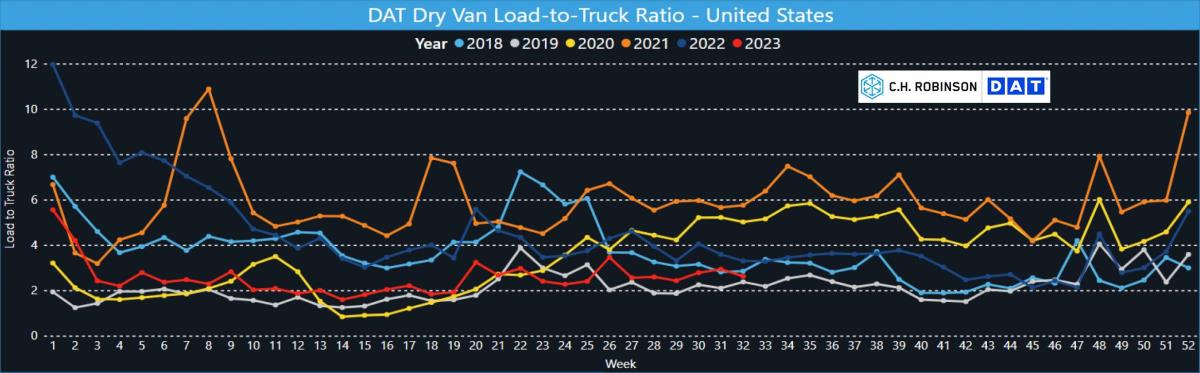
Nationwide LTR took a dip following the July 4th Holiday that held through week 29. This is a normal seasonal shift post the holiday with both the 5-year national average. Weeks 30 and 31 moved upward in similar pattern to the 5-year average pattern with week 32 turning down against the 5-year pattern.
The 3rd quarter in the 5-year average LTR displays a steady slope downward until about week 33 when the 5-year average bounce around the 20:1 LTR. This years LTR is a rather historical low, and patterns with very little change. The current map displays very effectively that trucking is regional with the national average LTR so far below historical norms but the Southeast displaying some sustained balance. The week 33 LTR is at 5.6:1 with little change week over week. for many weeks now.
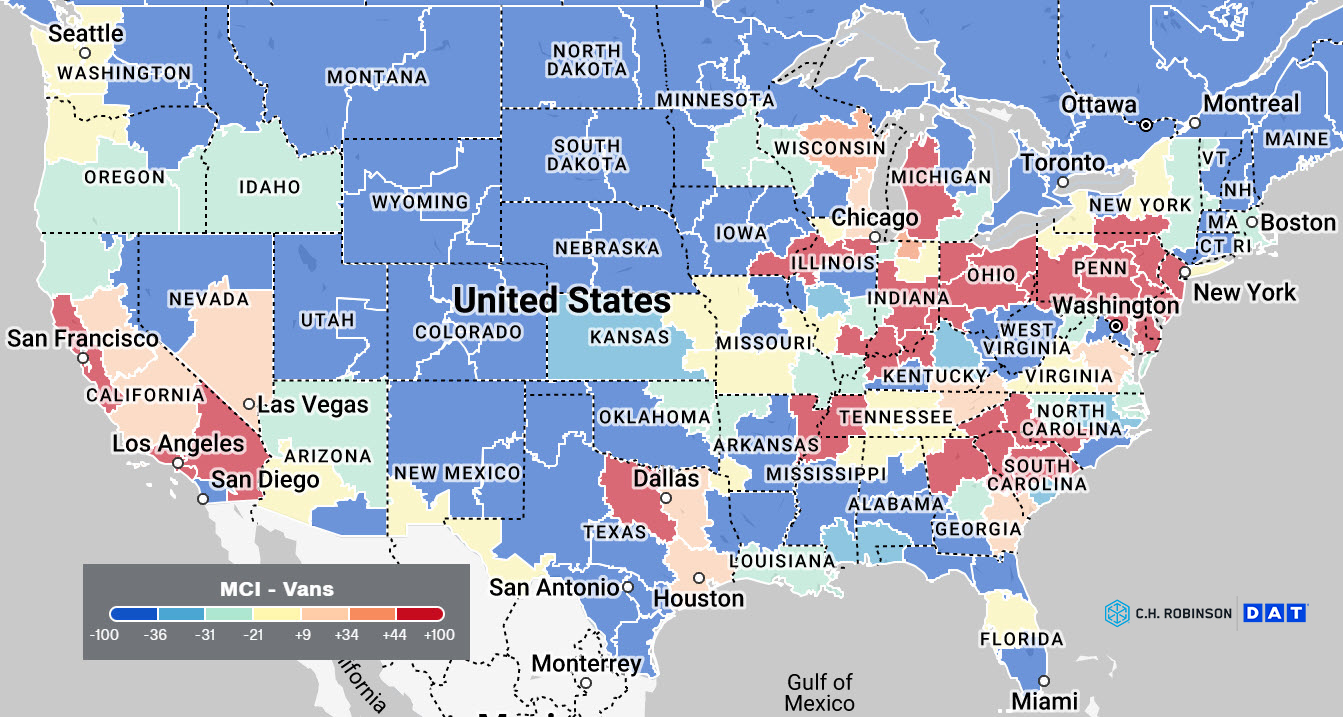
National averages are helpful for aggregate perspectives of the market. Trucking, however, is a very regional business. Each week displays the varying experience of the trucking market. Shown below is week 32, August 6-12, 2023.
Some markets are in balance, while others may be over or undersupplied, and other markets may have little trade and freight. The freight experience in each market influences truckload capacity strategy, and that experience will vary with annual cycles.
Sponsored research by C.H. Robinson with MIT's Center for Transportation and Logistics has shown that there are four primary market segments. Those being 'balanced' trade corridors, 'headhaul' corridors, 'backhaul' corridors, and 'sparce' corridors. Shipper freight attributes combined with the market segment capabilities shape capacity strategies from committed to spot market strategies. Connect with your C.H. Robinson representative to learn more about our Procure IQTM experience and our researched insights that can help develop a more capable truckload strategy.
Dry van displays a low level of tension across the United States. The produce season impact has largely completed its impact on dry van markets.
The national average is 2.6:1 against a five-year average around 3.8:1. Broadly speaking, spot market capacity is readily available in all markets when a day's lead time is offered.
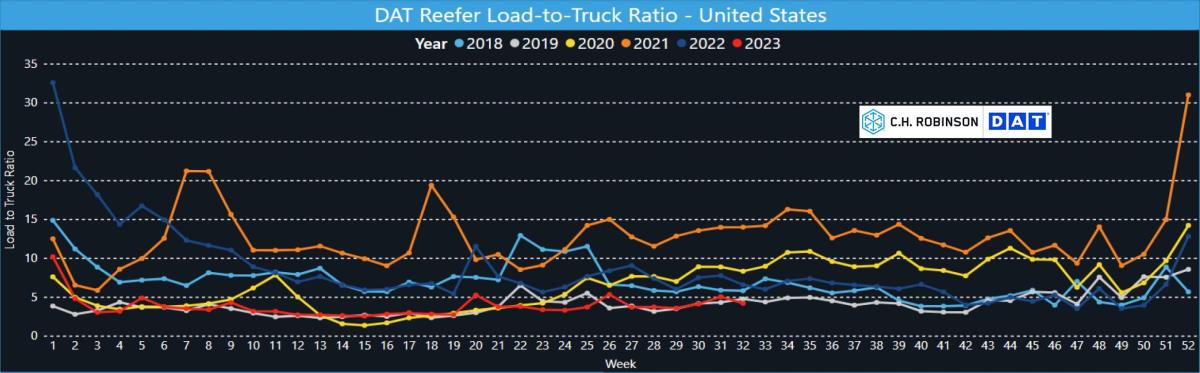
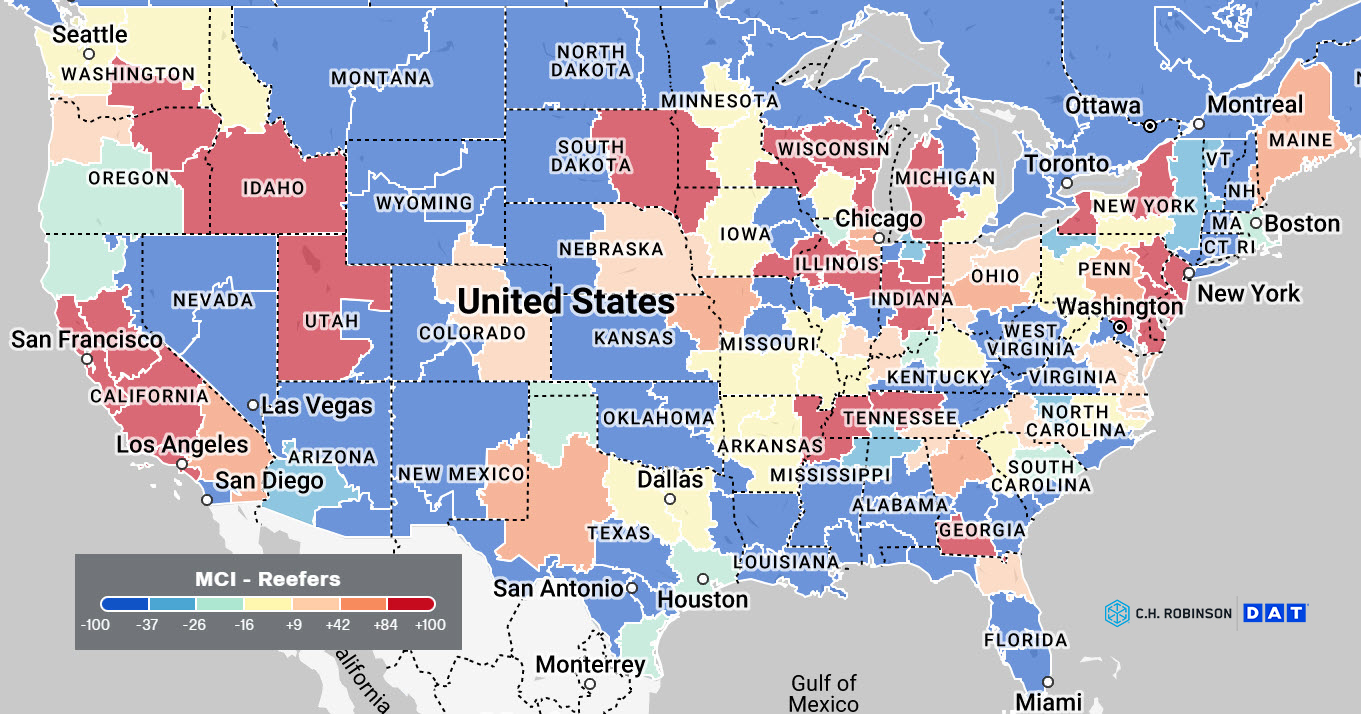
Note the level of available capacity this year is plentiful, leaving the produce growing regions well supported. Produce growing markets at this time of year are The Southeast, Southern CA, Texas valley and Norther Mexico. National LTR average for week 32 was 4.2:1 range against a five-year average around 8:1.
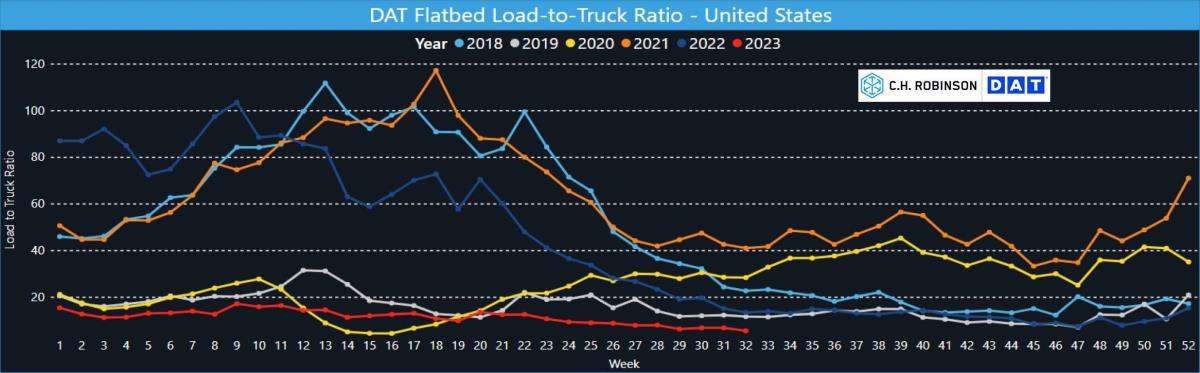
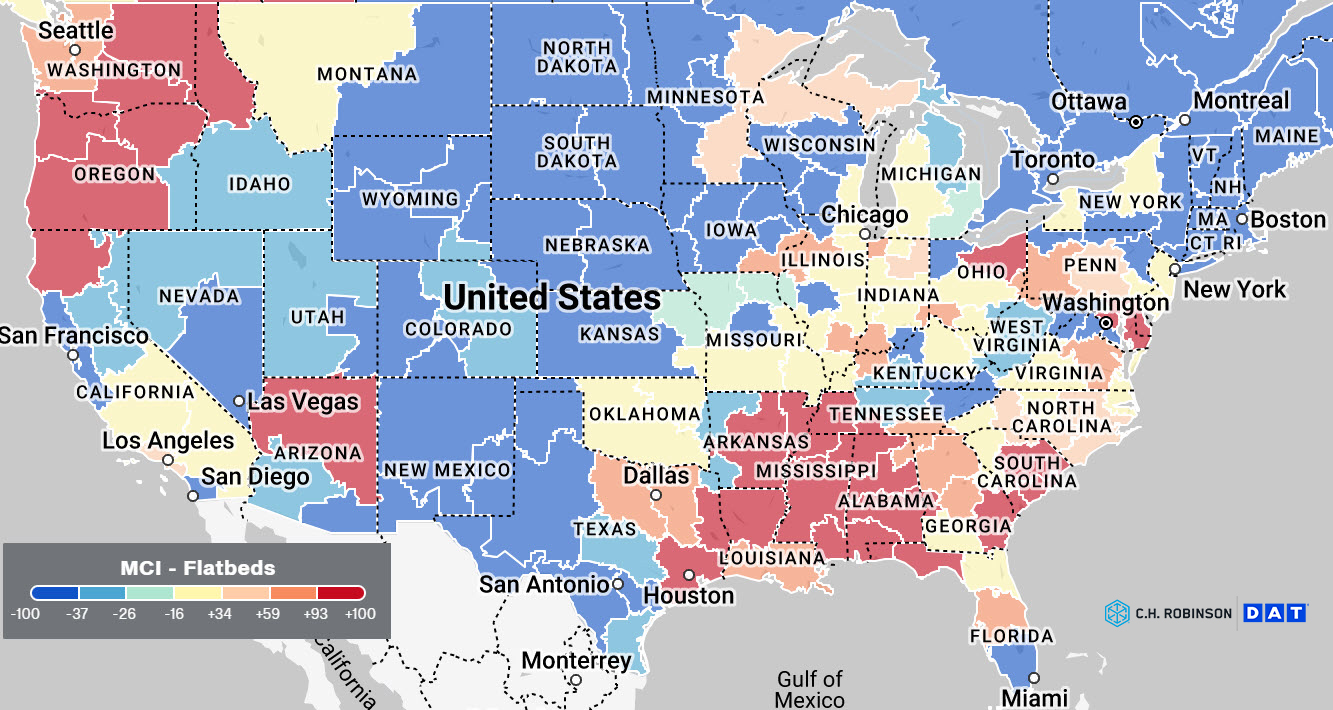
Today’s flatbed spot market LTR continues to show prolonged regional tension in the south from Texas, eastward. Broadly, the flatbed market offers plentiful capacity for spot and contract services nationwide. Week 32 LTR's were 5.6:1 with a five-year national average of 23:1.
Contract truckload environment
Most (75%–85%) of the U.S. for-hire truck market is moved through commitments most often managed via hierarchical route guides and dedicated truckloads. Most analysts are now offering that a material shift from 75% (some analysts suggested an even smaller share) of freight in the contract market in 2021 and early 2022 back to roughly 85% (some suggest a bit more) of freight in the contract market currently.
Route guide performance
Companies commonly use waterfall (or hierarchical) route guides to manage awarded freight on lanes with some level of demand pattern predictability. The following insights are derived from TMC, a division of C.H. Robinson, which offers a large portfolio of customers across diverse industries throughout the United States.
Two key metrics of route guide performance are first tender acceptance (FTA) and route guide depth (RGD). RGD refers to how far into a route guide a shipper must tender shipments before carriers accept loads, or the average number of tenders per load. FTA is a percentage of how often the first awarded transportation provider accepts their shipment tenders.
These insights are from the week of August 6-12, and also reflect on RGD from the month of July 2023.
The regional view no longer shows the Northeast as the highest RGD region. The July North America average RGD improved less than 1% from June to July after a less than 1% drop in performance from May to June. The July average RGD for North America improved 11% (improved performance) compared to July 2022.
Week 32, offers an unchanged national average RGD of 1.14. All regions of the USA are experiencing similar route guide performance. This view of contract truckload route guides performing exceptionally well is yet another evidentiary point that the truckload market is at its bottom.
Overall, route guides are performing very well, with primary service providers accepting loads at pre-pandemic levels and the first backup provider accepting rejected tenders most of the time.
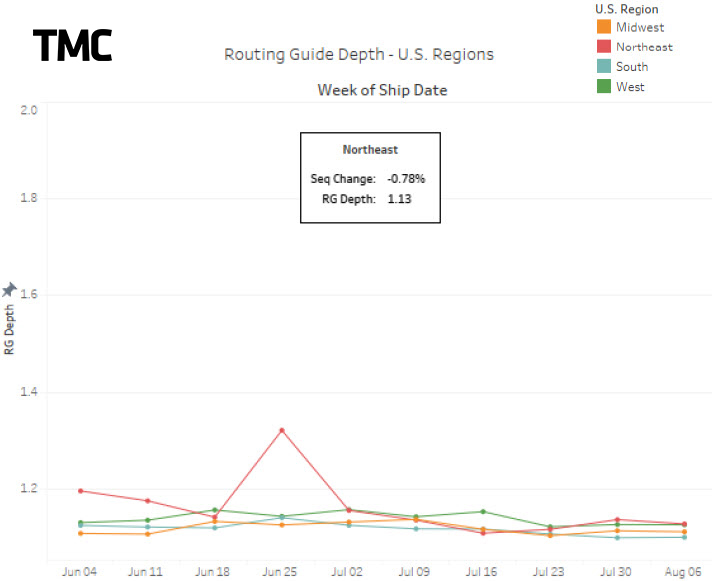
The chart above from TMC, a division of C.H. Robinson, reflects weekly RGD regionally across North America through the week of August 6-12.
- FTA in July was unchanged from June's 90%. The Y/Y comparison is 87% for July 2022.
- RGD broadly is rather stable, further supporting the reality of a well-supplied market.
Today’s market is flush with capacity. Load tenders from hierarchical route guides are typically accepted by the primary awarded supplier. When rejected, they tend to be unattractive to carriers for reasons such as unpredictable demand, short lead time, or known locations with high dwell event history.
A stable RGD performance for each of the three shipment distance bands continues. Route guide depth is largely at 1.1 to 1.2 depending on the distance band with short haul doing the best and medium distance loads showing the most first tender rejection and deepest route guide performance.
July's distance band performance (improved means better route guide performance and declined refers to more backup carrier use):
- Short haul (less than 400 miles) posted a declined in RGD of 1% from June and improved 8% Y/Y—about 1.1
- Middle distance (400–600 miles) improved less than 1% from June and improved 11% y/y. At 1.2 is the lowest RGD for July in the last six years.
- Long distance (over 600 miles) RGD improved by less than 1% from June to July and improved 12% y/y. At 1.15 it is the lowest/best RGD performance for July in the past six years.
U.S. spot market dry van truckload rate per mile insights
Formally introducing our 2024 TL temperature control cost per mile forecast for an increase in average cost in 2024 by 18% over 2023. Refrigerated truckload market dynamics are similar to dry van and pricing follows a similar pattern. Typically, the refrigerated market runs a premium to the van cost per mile of about 20%. Below we plot the refrigerated truckload cost per mile without fuel.
Our Dry Van TL cost forecast of -24% in 2023 and +20% y/y in 2024 is unchanged this month, however the balance of supply and demand data is pointing to a more elongated truckload downcycle. While we have already right sized the 2023 forecast of -24% y/y growth to this environment, we think this exerts some downward pressure on the 2024 forecast of +20% growth y/y. We think the upturn in the truckload cycle could occur a little later than the very early 2024 that is embedded in the current forecast.
We still believe the volatility of truckload cost is increasing over time, resulting in a truckload cycle with greater amplitude. We can observe this in the chart below that shows historical DAT Linehaul Broker to Carrier Cost Per Mile going back to 2011 in navy blue. On the right you will see the CHR Linehaul CPM forecast for the 2nd half of 2023 and 2024 as a dashed light blue line. We can also observe the magnitude of the change in cost from the cycle troughs to peaks has been increasing since 2011. This is also reflected in the annualized growth rates of the peak vs trough trendlines. The peak trendline is growing at a 4.2% annualized rate, roughly twice the 2% growth of the trough trendline.
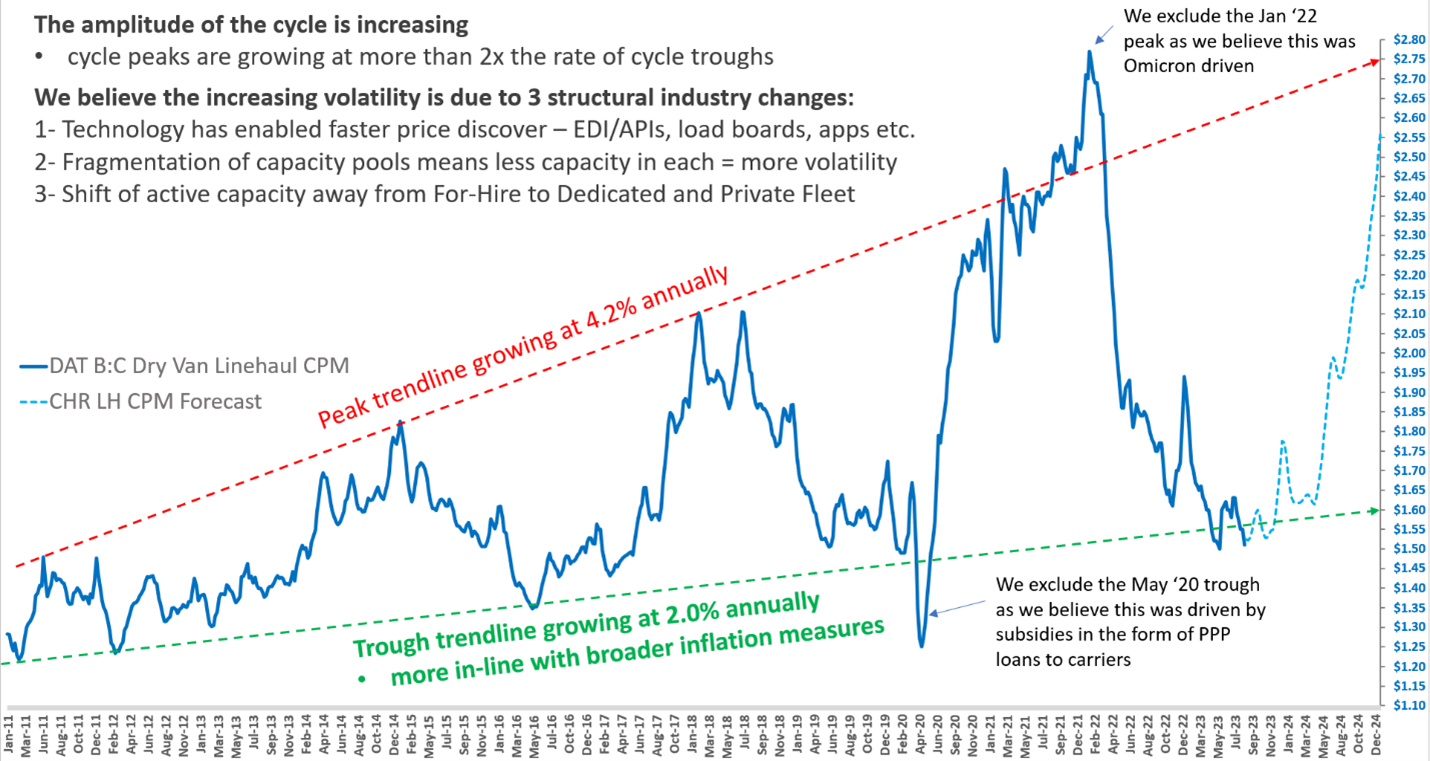
We believe there are 3 structural shifts in the industry driving the volatility that is increasing the amplitude of the truckload cycle:
- Technology has enabled faster price discovery.Cost moves much faster to find its new equilibrium. Today there is a prevalence and increasing number of EDI/APIs, auctions, load boards, apps, and price benchmarking services.
- Fragmentation of capacity pools means less capacity in each = more volatility. More load boards, TMS platforms, auctions, and other pools of capacity mean that there is less for-hire capacity in each individual pool. The technical term for this is liquidity, or how easy it is to facilitate a transaction. Less liquidity makes it more difficult to match a load to a truck, which drives a wider bid/ask spread.
- Shift of active capacity away from for-hire to dedicated and private fleets The exact same dynamic as #2 above, less active capacity, but applied to the whole for-hire industry also drives more volatile pricing. This applies especially to Transactional freight markets as asset dedicated segments and private fleets don’t participate in transactional markets.
On the supply side, we believe the primary pain point is that class-8 tractor OEMs production levels remain elevated for this late stage of the TL down cycle. ACT Research has raised their forecast for growth of US class-8 tractor population in 2023 throughout the year from 2.3% in January to 3.9% in their August report. We believe this is also driven by #3 above, shift of capacity to dedicated and private fleets. These two segments are consuming more of class-8 tractor production. We noted last month that the Cass 2Q23 Freight Index shipment volume decelerated significantly to -4% y/y and this continued into July, with further deceleration to -9% y/y. The dynamic of Class-8 tractor production levels that are elevated and increasing, while freight volumes are declining probably pushes out the timing of the upcoming truckload up cycle by at least a few months.
When we look at the fleet statistics of the large public asset carriers their aggregate tractor counts peaked in 4Q22 and have declined 3% from that peak level in 2Q23. So, in aggregate they are rationalizing capacity at a slow pace. However, when we drill down and compare growth in their OTR/for-hire segments vs their dedicated segments, we see that growth in dedicated segments, over the same period has outperformed OTR/for-hire. JB Hunt has led the charge in this area decreasing tractor counts in their for for-hire segment (JBT) by 22% from 4Q22 to 2Q23 while increasing tractor counts in dedicated by 3% over the same period.
These two segments of the truckload industry, dedicated, and private fleets, don’t order trucks unless they will be utilized. This means shippers have decided to send more of their volume through their private fleets and carrier dedicated segments. This means less volume goes to for-hire segments. The bulk of this capacity shift however is in larger fleets, thus creating a need for the shipper community to increase dependence on smaller carrier capacity strategies.
Cost per mile forecasting
Forecasting the timing of the flip to the upcycle at this point is fluid with complicated variables and has a large impact on our 2024 TL cost growth. On the supply side while most metrics are moving in the right direction, the pain point for where we are at in the cycle, capacity rationalization, seems to be the key challenge to forecasting coupled with the pattern of strong retail sales of new class-8 trucks as outlined above. There is some debate around whether these high tractor production levels are just replacing older tractors in an effort to address the shortfall of production due to supply chain constraints during the pandemic. If we don’t see some combination of OEM production cuts, order cancellations, active capacity leaving the market, or a material uptick in freight volumes in the near term, the risk is that the freight cycle upturn could occur later than the early 2024 projection that our current forecast is based on.

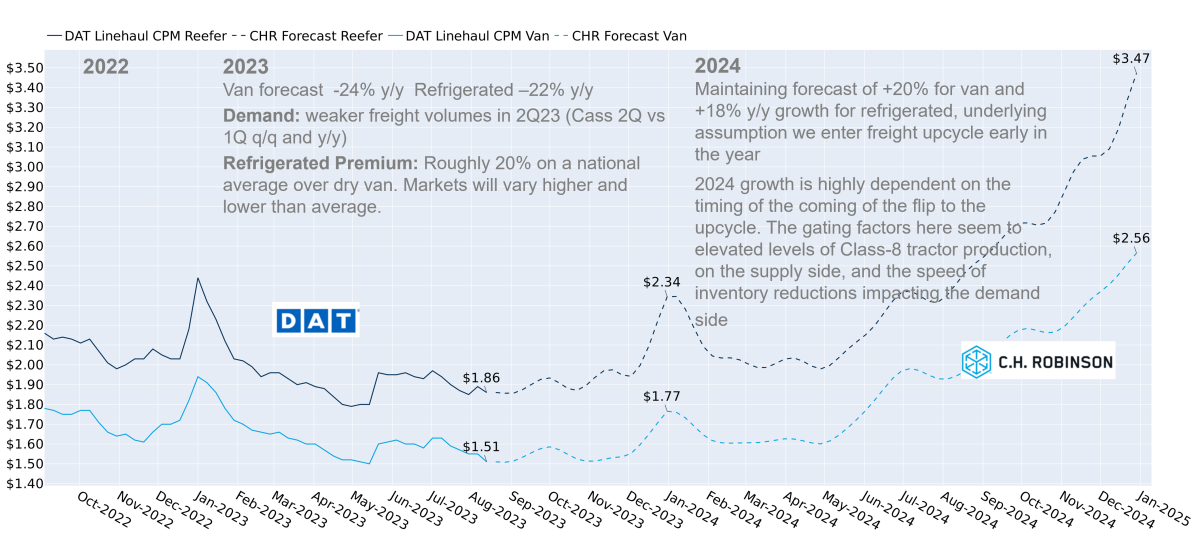
DAT Rateview national dry van and refrigerated linehaul cost per mile is the broker price paid to carriers per mile, which excludes fuel surcharge. The C.H. Robinson forecast is an extension of that cost.
Like others, this forecast has been and will continue to be amended as economic forces shape freight volumes and the capacity community responds.
- The darker blue line is representing refrigerated cost per mile
- The lighter blue line is representing dry van cost per mile
- The solid blue lines are DAT Rateview’s broker cost per mile paid to carriers without fuel
- The dashed lines are the C.H. Robinson forecast for 2023
- Forecast change Y/Y is full year average cost/mile vs. full prior year average cost/mile
A final note on contract pricing
Contractual pricing remains low. If a shipper's contract pricing is exceptionally low, it is possible to experience some first tender rejections during the seasonal moves and higher backup pricing as the market experiences seasonal and regional pressures and year end market evolution.
The large portfolio of shipments C.H. Robinson handles is just one of the reasons carriers choose to haul for us. With so many load options, carriers can more easily find loads that decrease operating expenses. This in turn creates more capacity options for shippers that work with C.H. Robinson.
Diesel fuel retail pricing
With benchmark crude pricing up 21% over the past 6-7 weeks, diesel is also on the rise with wholesale diesel costs up 31% in the in the past three months. The recent run up has been influenced by Saudi Arabia and Russia cutting production in an effort to influence market supply. Analysts have also suggested that investor optimism about the economy has helped bolster the rise in oil prices.
Keeping with our opening theme on refrigerated transportation, it is notable that with the July and August heat waves refrigerated trucks are burning more fuel to keep products cold in transit.
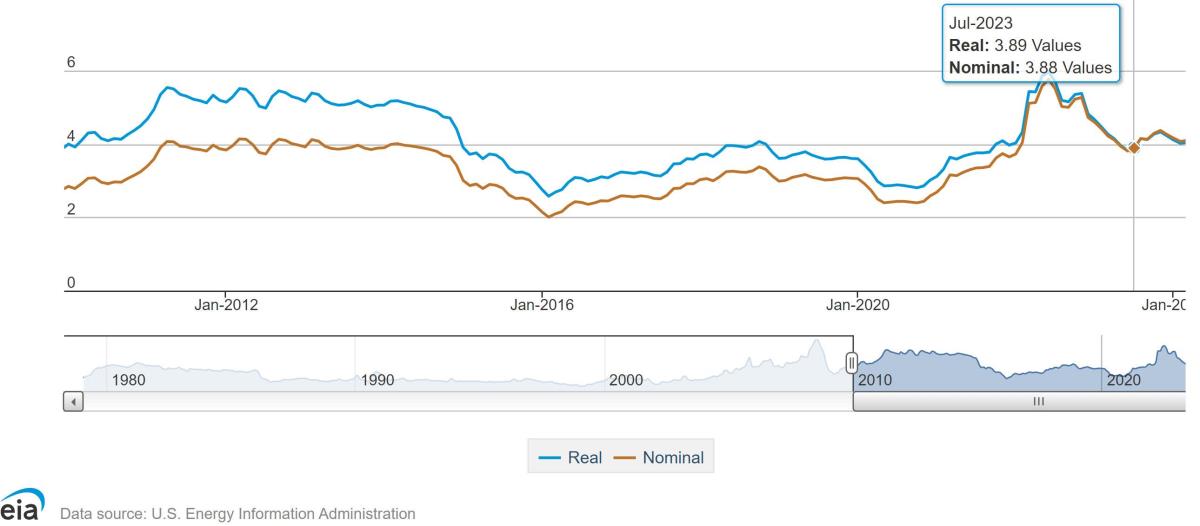
In their August 8, 2023, Short-Term Energy Outlook, the EIA estimates June 2023 real retail diesel pricing at 3.89/gallon, up from June's 2023 low of $3.82 national average. For perspective, July 2022 was at $5.68. Finally, in March 2020, the beginning of the pandemic, diesel was $3.23/gallon.
The report also forecasted December 2023 at $4.21, a notable increase from the past few months forecast.
Voice of the carrier from C.H. Robinson
C.H. Robinson has two customer communities, shipper customers and carrier customers. What follows are insights from conversations with carriers of all sizes to offer perspective into their top concerns over the past month. Below is a summary of the reoccurring themes.
Market insights
- Carriers confirm market continues at over supply bottom
- Contract award volume commitments are volatile week to week
- Shipper score cards are being managed with increasing discipline
Equipment insights
- Increasing numbers of carriers cite downsizing fleets to right size against demand
- Trailer pricing is coming down as inventory grows
- Used tractor pricing is starting to decline some
- New tractor pricing has not declined
Drivers
- Hearing of more owner operators exiting the business
- Some smaller carriers mentioning small wage decreases
A key value proposition of C.H. Robinson is aggregating lane volume and demand pattern variability to a more predictable experience. Our carriers have more predictable volume from C.H. Robinson and as a result are interested and able to offer consistent capacity and market pricing with high performance.
Places where the global supply chain meets North American supply chains—like ports and airports—are also affected by the cyclical market and other disruptors. Below we offer some of the current notable situations.
Resumption of operations after the Vancouver / Prince Rupert work stoppage likely to create freight concentrations
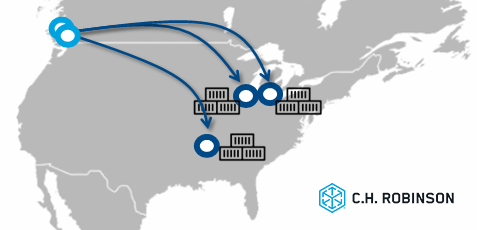
Many of the containers that were backlogged due to the Canadian Labor Strike will move to Chicago, Detroit, and Memphis now that an agreement has been reached. Even more these containers are expected to arrive in a concentrated burst. This has the potential to overwhelm the terminals and chassis supply in those markets. Customers should be aware of the potential for increased accessorials including SSL Detention, Demurrage, and Rail Storage. Reach out to your C.H. Robinson representative if you have any questions/concerns as it relates to your routing guide(s).
- Carriers in Jacksonville have reported major backups in the Blount Island terminal, the Jacksonville market's largest terminal. It is due to higher container volumes and a construction project, causing congestion and a volume imbalance between Blount Island and Dames Point terminals. The construction project is expected to continue until the end of 2024.
- After a 3-month trial The Georgia Port Authority (GPA) has indefinitely suspended Sunday gate hours as of June 30th at the Savannah Port. GPA states declining volumes and not enough truckers taking advantage of the additional day open.
- NY/NJ – CMA shipping line is realigning the ports in the area. This has caused some moves to the NYCT (New York container terminal). This will cause an additional toll charge and diversion on every move from bridge tolls.
- Buffalo, NY – A large number of chassis have been pulled from service to be maintenance. This has caused a shortage of chassis at this time
- Cleveland/Columbus – Cleveland is experiencing timely and accurate information updates leading to challenges getting at containers at the Norfolk Southern ramp.
- Kansas City – We are seeing delays in the terminals for container flips and chassis providers pulling equipment from the market for repair and refurbishment.
- LA/LB – empty returns for MSC are subject to only dual transactions (empty in and full out). This requirement is exacerbated due to the shift in export volumes to the East and Gulf regions there may be increased difficulties related to equipment availability and capacity at ports and ramps in those regions.
- SEA/TAC – The PNW ports are seeing a significant slowdown due to the labor contract disputes. As a result of the slowdown, according to PMA (Pacific Maritime Assoc.), ships are sitting idle without being able to move cargo and causing a backlog of incoming vessels.
- Houston – A new container drop yard is providing the solutions many of our carriers have been looking for. The drop yard is a 75-acre off-terminal depot, directly adjacent to Port Houston's Barbour's Cut Terminal, offering a secure location for the storage and staging of containers.
Temperature controlled shipping
Produce Season update:
Cost per mile increases were 25%-30% may to the USA July 4th holiday. These increases were driven by prime growing markets, especially outbound California. Since the holiday, national pricing has settled back about 50% of the increase. This period is typically a lull in cost prior to the fall harvest and year end peak retail season.
Yellow Freight closure:
There appears a connection of the Yellow Freight closure in the Northeast and sustained tension post the produce season. Enough carriers turned off their refrigerated units and offered dry spot market service to support orphan freight from the closure of Yellow. This shift of refrigerated capacity was enough to sustain some market tension.
Drop trailer services demand increases:
We are seeing an increased demand for drop trailer refrigerated services. RFP's in July sought about 50% of services to be drop trailer which is a significant increase from historical patterns. CHR's refrigerated drop trailer services are growing at a rate very similar to the market demand and are available through your C.H. Robinson representative.
Flatbed
Flatbed continues to offer plentiful supply and markets/lanes where carriers historically resist load opportunities are now more willing to serve. Pricing continues to be at the bottom and likely to hold there for the rest of the year.
The oil and gas sector is showing healthy balance of supply to demand and able to support summer driver vacations and very few load tender rejections.
Driver recruitment is in a healthy position and carriers report quality of candidates is high, enabling strong service levels.
1 bright spot in 2023 for flatbed freight volumes is cross border north bound from Mexico into the USA within the manufacturing sector.
Cross-border shipping: Canada
British Columbia Port strike averted
Following a 13-day strike and rounds of negotiations, nearly 75% of the ports workers voted to ratify the new agreement.
ELD's are mandatory in British Columbia as of August 1st
A six-month grace period for adoption has ended, requiring ELD's to be used. Concerns for capacity impact have not materialized due to current freight market of plentiful capacity against soft freight volumes.
Overall, the intra Canadian and Cross Border truckload freight market is over supplied. Capacity is broadly available and pricing remains near or at the cost of operations according to the carrier community. Fuel pricing increases appear in fuel surcharges, but are not influencing rates per mile. Now is an exceptional time to work on long term truckload capacity strategies in an effort to prepare for the next upcycle.
Cross-border shipping: Mexico
A new extension has been issued that extends the transition time for complying with correct data elements. Fines for incorrect data elements will not be incurred until December 31, 2023.
The total number of tractors/units on the road have grown an estimated 5% y/y June. According to the General Directorate of Federal Auto Transport. This has not contributed to decrease the average age of a unit in Mexico trucking fleet which is 20 years. Source: tyt.com
Last May, auto parts production reached an all-time high for auto parts manufacturing in Mexico. The value of the auto parts industry grew 26.0% compared to pre-pandemic levels and about 21.0% compared to the same period in 2022, according to Armando Cortés, general director of the National Auto Parts Industry (INA). Source: T21
Cross-border[SR1] ‘direct’ capacity is plentiful and pricing continues to be very competitive. As a result, use of direct service vs. cross border service is growing rapidly. It is possible to see a 30% increase in this service through the end of the year as shippers build their 2024 capacity strategies.
Mexican transload cross border carriers are increasing their service offering through a greater number of exchange agreements with USA carriers, creating more capacity options that will help sustain service when the market tightens. This strategy helps the transload service compete with direct service while pricing is so competitive[SR2] .
Cargo theft continues its pattern as reported in previous months. We advise our clients of the following concering áreas: The central part of Mexico and the states of Mexico, Jalisco and Puebla which account for over 50% of thefts. Other states with rising rates of theft include San Luis Potosi, Guanajuato and Queretaro. Over the past month, Laredo ports have experienced increased issues prompting some carries to Work only during day light hours. Delays in transit are a derivative of shorter Work hours.

Get the latest produce industry insights in our newsletter from Robinson Fresh.®

Intermodal Shipping
TOP STORY: Now is the time to develop an intermodal strategy
Intermodal domestic volumes have stabilized. North American domestic volumes appear to be gathering upward momentum as volumes rise slightly above seasonal trends for the second month in a row. Volumes are forecasting to increase month over month building into a muted peak season. We expect to see a dip in overall volumes in the July data as we see impacts from the Canadian ILWU strike.
While volumes remain down Y/Y, there are no capacity-constrained domestic container markets. Now that drayage and rail capacity are abundant it is a perfect time to look at solutions that did not fit as well in the past. A number of new domestic north American options have come into offer this year.
Spot rail pricing tends to lag truck pricing by four to six weeks and is now near 30% lower Y/Y. The pace of decline appears to be slowing, as we may have reached a bottom on this cycle. The lower cost of diesel is applied additional pressure to IMDL savings. However, with diesel price increases pricing pressure could be lessened. Contractual rates while still down are normalizing.
FTR's pricing pressure index projects a slight recovery in rates during the peak season and contracted rates are forecasted to finish 2023 at an average of -2.8% Y/Y. The rails are still offering discounts in historically deficit markets. Making commitments now in markets like southern California and outbound Mexico will result in lower rates and favorable capacity allocation agreements before the market shifts back to historic norms.
Now is the time to update expected rail transit times. The transit times have normalized above averages. This may make the rail better positioned to support your supply chain needs. This is especially true on any containers riding the CPKC. Additionally, expedited service options provide savings with similar speeds to over the road in many lanes.
The railroads are looking for unique solutions to get more containers on their networks. Set your strategy for 2024 now.
Less Than Truckload (LTL) Shipping
TOP STORY: Yellow Freight Market Insights
Operations have been suspended and on Sunday August 6th, Yellow Freight filed Chapter 11 bankruptcy. Yellow discontinued accepting freight before shutting down, in an effort to deliver the freight within its network. A small percentage of their daily volume was not delivered before the final day of operations and terminals are offering some operations to allow for rescuing the final shipments in their network. We recommend making appointments with terminals before sending in a truck to pick up shipments.
Many of Yellow's terminals were owned by other carriers and leased back to Yellow. In some of these situations, the terminal owners may work quickly to convert the terminal into their operations to help address the influx of freight that was formerly Yellow.
LTL carriers offering national services were able to absorb much of the Yellow volume. These initial carrier selections are not necessarily proving to serve as the permanent routing, as regional carriers are likely to see additional volumes awarded.
Freight volume embargos
The shift of Yellow freight to other carriers taxed some carriers and regions more than others. As such, some carriers have issued embargos on additional freight for certain terminals due to lack of capacity. The longevity of the embargos is uncertain, but we might advise our clients to expect them to last through September.
Mergers and Acquisitions
Consolidation continues in this trucking segment with following most recent changes:
- Clear Lane will be operating under Frontline this month. Both Frontline and Clear Lane are owned by STG logistics.
- Express 2000 was acquired by Cross Country last week
- We can expect at least one more M&A in 2023 from a larger regional carrier working towards nationwide presence
Pricing insights
General Rate Increases (GRI) increases
- August offered six out of cycle GRI's with 10 of the top 20 carriers issuing General Participation GRI’s, some were out of cycle and some their yearly adjustments.
- Increases range from 4%-31% overall increase
- Average increase for all carriers is 10% overall increase
- These increases are a reminder of what transpired during the pandemic
- Pricing discipline continues to be a major factor. Carriers are advising shippers that large quantities of additional new/unfamiliar freight may not move under existing general pricing. Proposals and negotiations are common as freight continues to search for its best next alternative to Yellow
Small Parcel
Shown below is the total parcel revenue from carrier public records and CHR estimate of regional carriers
The pandemic period brought a spike of parcel that triggered a volume shift from B2B to greater B2C and advanced the online consumer shopping mindset perhaps up to 7 years.
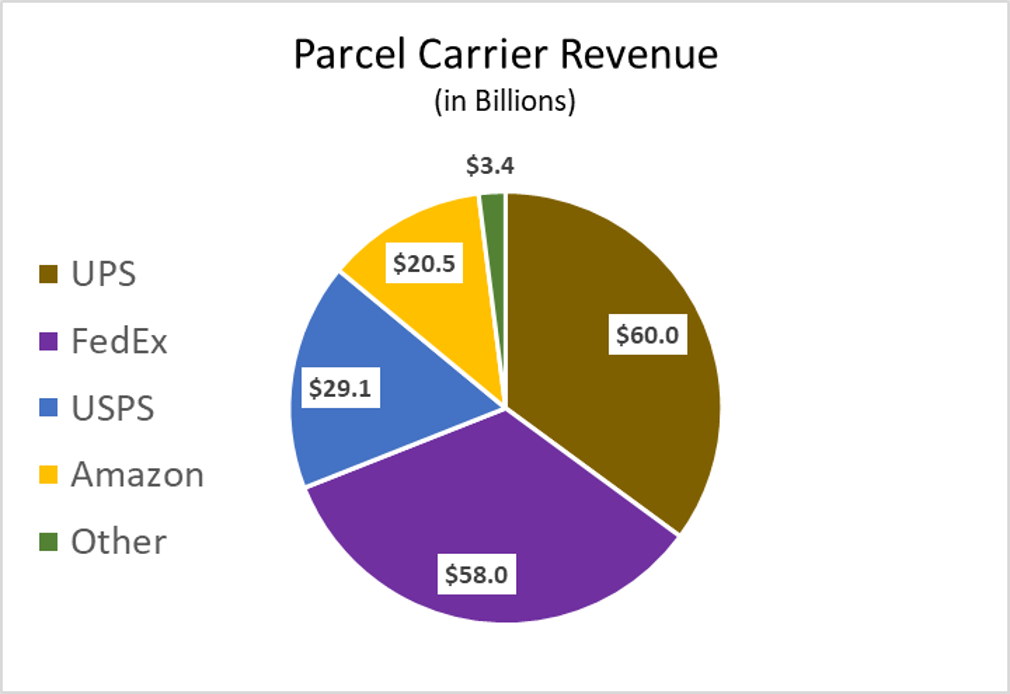
Source: Statista.com
As a result of increased B2C, the average package size dropped and there was additional drift from LTL to parcel as some segments with LTL saw shipment sizes decline. As a result, carriers are imposing accessorial charges to avoid undesirable freight
The regional carrier community (presented as 'other' in the graphic above) is taking advantage of the UPS and FedEx intentional strategies to decline servicing undesirable parcels.
Market share by revenue is showing interesting evolution of the industry when comparing 2022 to 2010. The USPS package volume is growing, while total revenue is as a percent of the market is largely unchanged. UPS efforts in 2022 to strategically decline offering service in some B2C areas materially reduced their market share by revenue and FedEx picked up a meaningful increase over those years.
In 2023 shippers are likely focusing on risk mitigation in their parcel supply chain. Some shippers made an immediate shift to FedEx during the UPS labor negotiations and perhaps plan to keep a portion of their volume in the FedEx network long term. Additional diversification such as shifting to regional carriers is a strategy that takes a bit more time to implement and we anticipate seeing that shift growing throughout the rest of the year. Additionally, experts anticipate that UPS will need to raise pricing by ~8% + to offset the cost of the new labor agreement. If and how they make that rate change for 2024 (FedEx will likely make a similar move) could impact which parcels shippers consider moving away from Nationals and into regional carriers.
Government and Regulations
TOP STORY: Summer Recess
The transportation industry is influenced by both legislative and regulatory initiatives. Congress’ annual August break puts a pause on the legislative activity. The FAA bill (Federal Aviation Administration) which was striving to authorize funding and update rules and programs to increase aviation safety and efficiency, passed the U.S .House, but not the U.S. Senate. With the current FAA bill expiring on Sept 30th of this year, it is increasingly likely that an extension of the current bill will be required as some contentious issues remain like pilot training rules and flight slots at the Washington DC airport. 2024 electoral politics is anticipated to slow down other legislation as attention is focused the election cycle and less on new legislation.
The regulatory process around transportation is likely to accelerate in the back half of this year. The FMCSA (Federal Motor Carrier Safety Administration) may propose a number of draft rules related to speed limiters, automated breaking systems or defining the difference between a freight broker and a dispatch service. FMCSA is also likely to issue a final rule that updates the agency’s “Safety Measurement System” that helps them prioritize motor carriers for enforcement interventions of all kinds.
Customize and download this report


