Jan 2024 North American Freight Market Updates
Updated February 28, 2024
Customize and download this report
What's in this Update
TOP STORY: Temperature controlled truckload forecasts follow dry van plus a premium
The temperature controlled truckload market is a subset of the larger truckload market that includes dry van, temperature controlled (reefer or refrigerated), flat bed, and tanker. Dedicated services are also a segment of the for-hire truckload market –they are skewed to dry van services, but temperature controlled services are also available. The dedicated services segment is influenced by similar forces as the broader temperature controlled market but brings two additional market influencers: fresh produce season and the need to provide protection from freezing for some products in cold weather seasons.
Below we offer some introductory insights into the shape of the temperature controlled truckload market, leaning into our spot market cost per mile forecast (published later in the truckload section of this report).
Market capacity top line
Perfect segmentation is difficult to offer, though temperature controlled is roughly 15% of the for-hire truckload market.
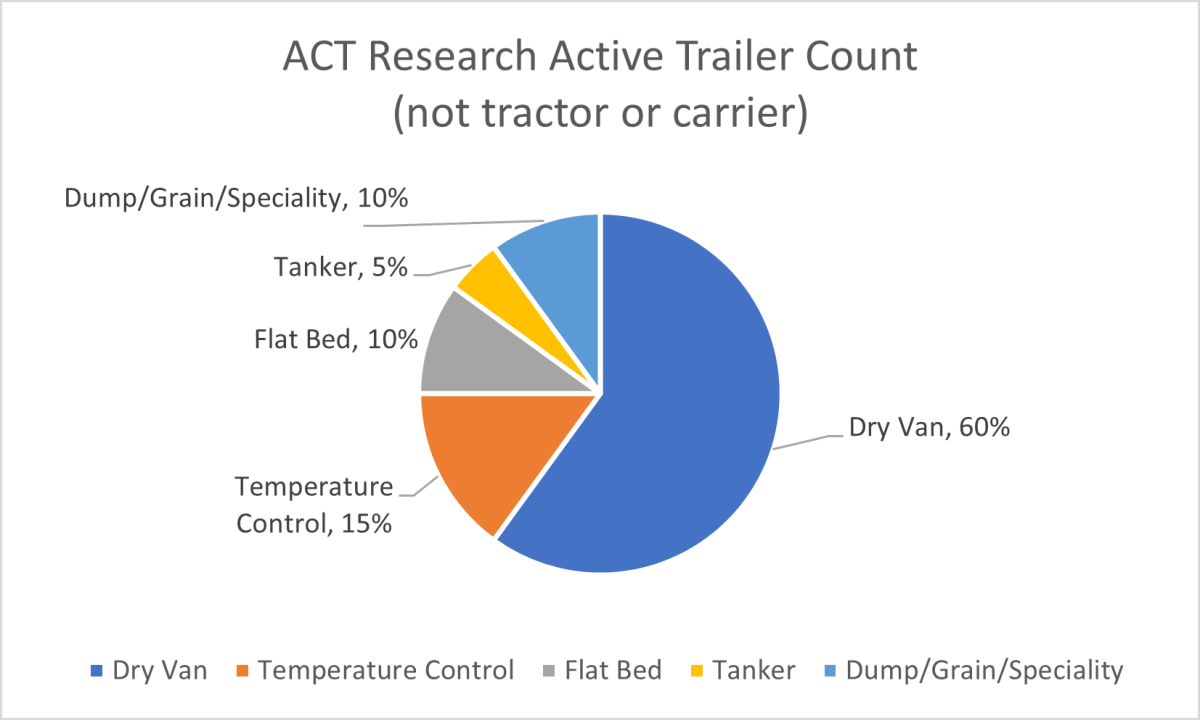
ASource: ACT Research active trailer count USA 2022
As shown above, temperature controlled capacity is materially smaller than dry van. Its top end capacity providers are made of fleets in the 400-3,999 size segment, with only 2 carriers at or crossing the threshold of 4,000+ tractors pulling refrigerated trailers. The bulk of the temperature controlled market is much like the broader market, heavily dependent on smaller fleet carriers.
Temperature service categories
The temperature control capacity community serves a portfolio of goods that require different temperature classes.
| Service | Temp range | Insights |
|---|---|---|
| Deep Freeze | Less than -14° F | Ideal for specific pharmaceutical products that require extreme cold to remain viable. This is a rather specialized and small refrigerated truckload equipment pool. |
| Frozen | -13° to 14° F | Ideal for a variety of products from ice cream to pizza, this range prevents thawing. |
| Refrigerated | 25° to 46° F | Ideal for food items like fresh produce, meat, and juice as well as other highly sensitive items, such as live vaccines. This temperature range keeps items cool without crossing into the frozen range. |
| Ambient | 59° to 77° F | Ideal for products that can't get too hot or cold. This range is about maintaining a constant temperature. |
Carriers in the temperature controlled market tend not to serve all four temperature segments. They may serve one to three, with most serving one or two only. Some categories, like refrigerated foods, have very specific restrictions for odor and cleanliness with low tolerances. As such, carriers moving refrigerated goods outside of the foods sectors tend to have limited participation in food shipments. This segmentation further limits the elasticity of the refrigerated capacity market and contributes to some of the increased pressure experienced during the fresh produce harvest seasons.
The interaction of van and refrigerated market capacity
Some refrigerated carriers turn off their refrigeration units during slower seasons for refrigerated freight and offer their services to the dry van freight shipper community. During this period, the van capacity is effectively increased. When produce season returns, the impact to the dry van spot market available capacity is often noticeable in growing/harvesting regions. As refrigerated demand increases and carriers pursue fresh produce loads, capacity available for dry van loads is lessened and dry van load to truck ratios increase and follow the growing season across the country.
Premium over van attributes
Refrigerated transportation premium is evident in our forecast highlighted later in this report. For simplicity it is often cited as roughly 20% over dry van. Refrigerated premium over dry van will vary by market (higher and lower). Displayed later in this report is our forecast. It is a national average cost per mile extension of DAT's Freightview broker to carrier cost per mile, without fuel.
- Seasonality of fresh produce season and the market origins tends to create additional deadhead/repositioning miles and cost
- Inherent risk due to freight characteristics and high rejection/claims ratio for temperature controlled products where failures influence quality and spoilage of sensitive products
- Cost to operate tends to be higher for reefer equipment starting with a higher price point for trailers, additional maintenance on refrigerated units, and refrigerated fuel that is not fully passed through. Truck drivers for refrigerated transportation often are paid higher than van drivers due to the extra work and liability of managing the reefer unit and trailer temperature.
Our first public release of the C.H. Robinson spot market refrigerated truckload cost to mile forecast has been added to our van forecast later in the TL section of the report. This is a blended forecast of temperature classes and an extension of DAT Rateview's broker to carrier cost per mile without fuel. As with our truckload forecast, this is a national average. Pricing will vary by lane, by temperature class, and freight/load attributes.
TOP STORY: The dog days of summer trucking
The summer trucking market continues to bounce along the bottom. It offers plentiful capacity and pricing that is not only challenging to the profitability and longevity of spot market carriers, but also to contract capacity carriers. Increasingly, carriers are citing pricing pressure and sporadic award volumes. The FMCSA continues to report some loss of carrier operating authority (albeit at a rate that is keeping the market over supplied) and small and medium fleet carriers are citing intentional contraction of their fleets to stay aligned with volumes. The national van carriers in Q1 reported 1.6% contraction in their active fleets. Since then they have been reporting continued efforts to contract the irregular route for hire capacity with focus on dedicated capacity for growth.
What follows in this section is our insights to the spot and contract markets, as well at C.H. Robinson cost per mile forecast for the spot market for both the dry van and temperature control segments.
Dry van is the largest segment of the truckload market. It is often the primary reference for the U.S. truckload market’s performance. For context, the dry van spot market has followed the somewhat normal seasonal tightening before the American Independence Day holiday on July 4, then was followed by normal seasonal softening post-holiday. Load to truck ratios (LTR) are still below the five-year averages of ~4:1, but are more balanced than they have been for some time.
The week 26 bump up leading to the 4th of July holiday in the USA settled back in weeks 27-29. Weeks 29-30 were slightly up, and following seasonal patterns weekly, both the 5-year average and the week 32 LTR dipped from previous weeks at 3.8 and 2.6 respectively.
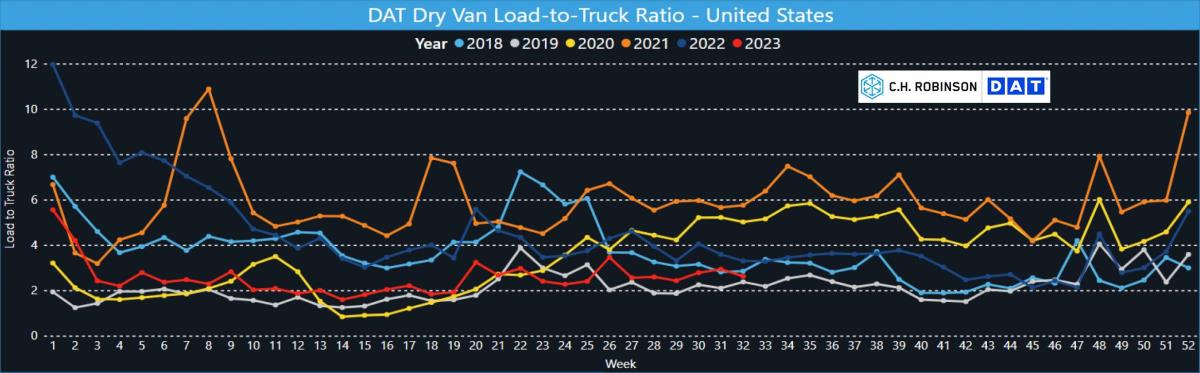
Nationwide LTR took a dip following the July 4th Holiday that held through week 29. This is a normal seasonal shift post the holiday with both the 5-year national average. Weeks 30 and 31 moved upward in similar pattern to the 5-year average pattern with week 32 turning down against the 5-year pattern.
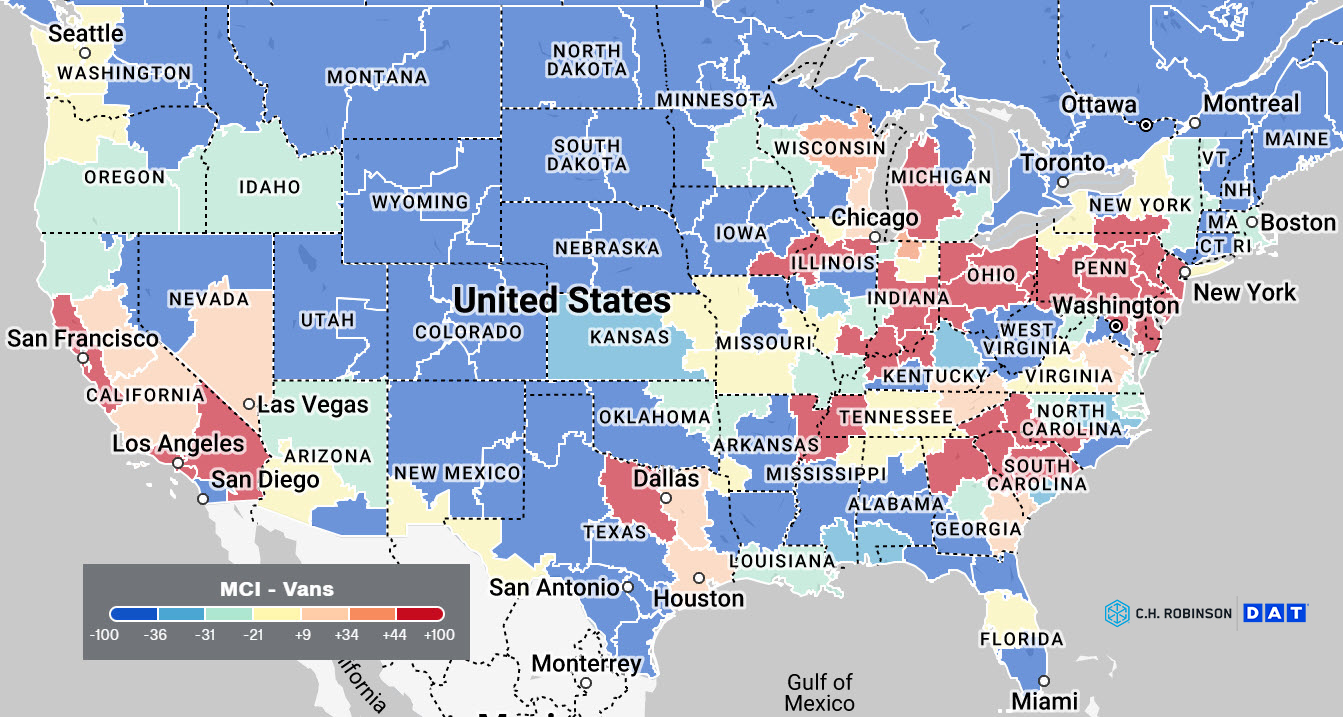
The 3rd quarter in the 5-year average LTR displays a steady slope downward until about week 33 when the 5-year average bounce around the 20:1 LTR. This years LTR is a rather historical low, and patterns with very little change. The current map displays very effectively that trucking is regional with the national average LTR so far below historical norms but the Southeast displaying some sustained balance. The week 33 LTR is at 5.6:1 with little change week over week. for many weeks now.
National averages are helpful for aggregate perspectives of the market. Trucking, however, is a very regional business. Each week displays the varying experience of the trucking market. Shown below is week 32, August 6-12, 2023.
Some markets are in balance, while others may be over or undersupplied, and other markets may have little trade and freight. The freight experience in each market influences truckload capacity strategy, and that experience will vary with annual cycles.
Sponsored research by C.H. Robinson with MIT's Center for Transportation and Logistics has shown that there are four primary market segments. Those being 'balanced' trade corridors, 'headhaul' corridors, 'backhaul' corridors, and 'sparce' corridors. Shipper freight attributes combined with the market segment capabilities shape capacity strategies from committed to spot market strategies. Connect with your C.H. Robinson representative to learn more about our Procure IQTM experience and our researched insights that can help develop a more capable truckload strategy.
Dry van displays a low level of tension across the United States. The produce season impact has largely completed its impact on dry van markets.
The national average is 2.6:1 against a five-year average around 3.8:1. Broadly speaking, spot market capacity is readily available in all markets when a day's lead time is offered.
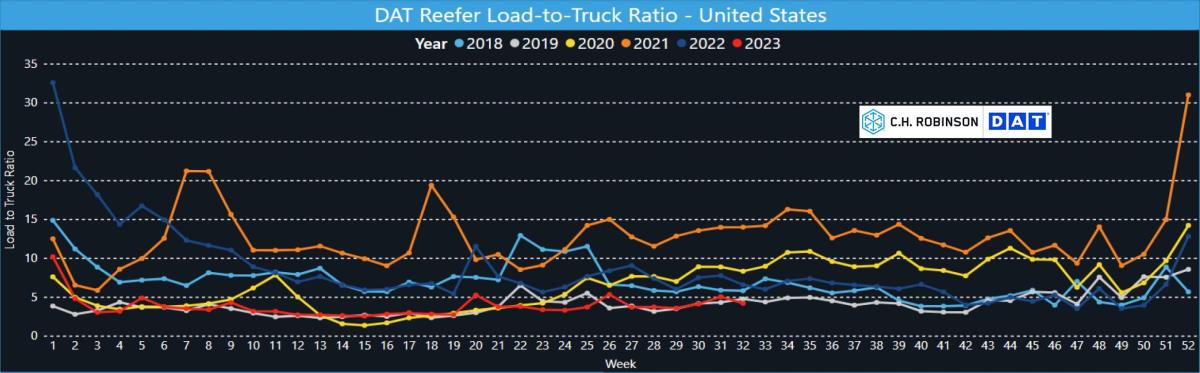
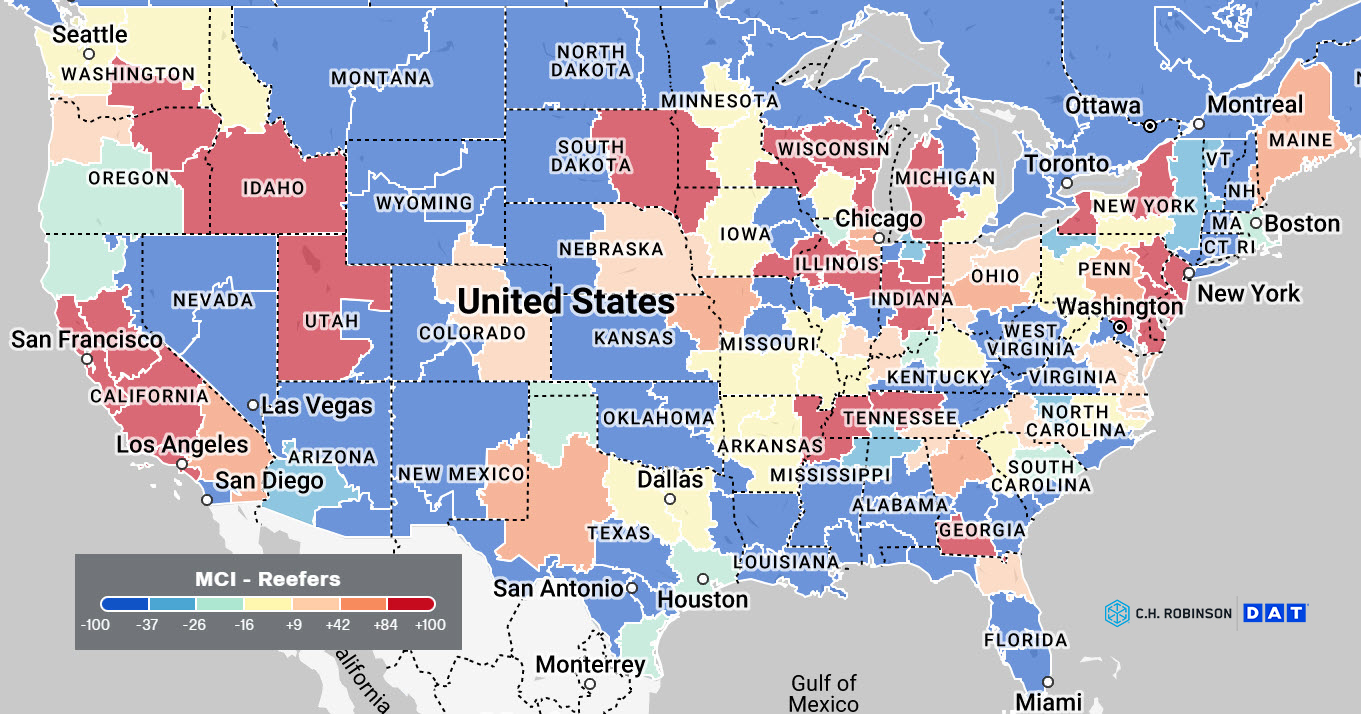
Note the level of available capacity this year is plentiful, leaving the produce growing regions well supported. Produce growing markets at this time of year are The Southeast, Southern CA, Texas valley and Norther Mexico. National LTR average for week 32 was 4.2:1 range against a five-year average around 8:1.
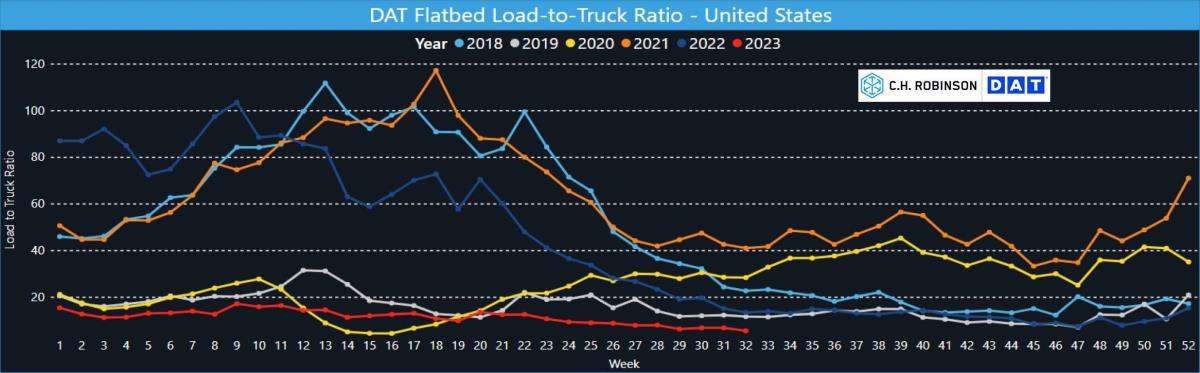
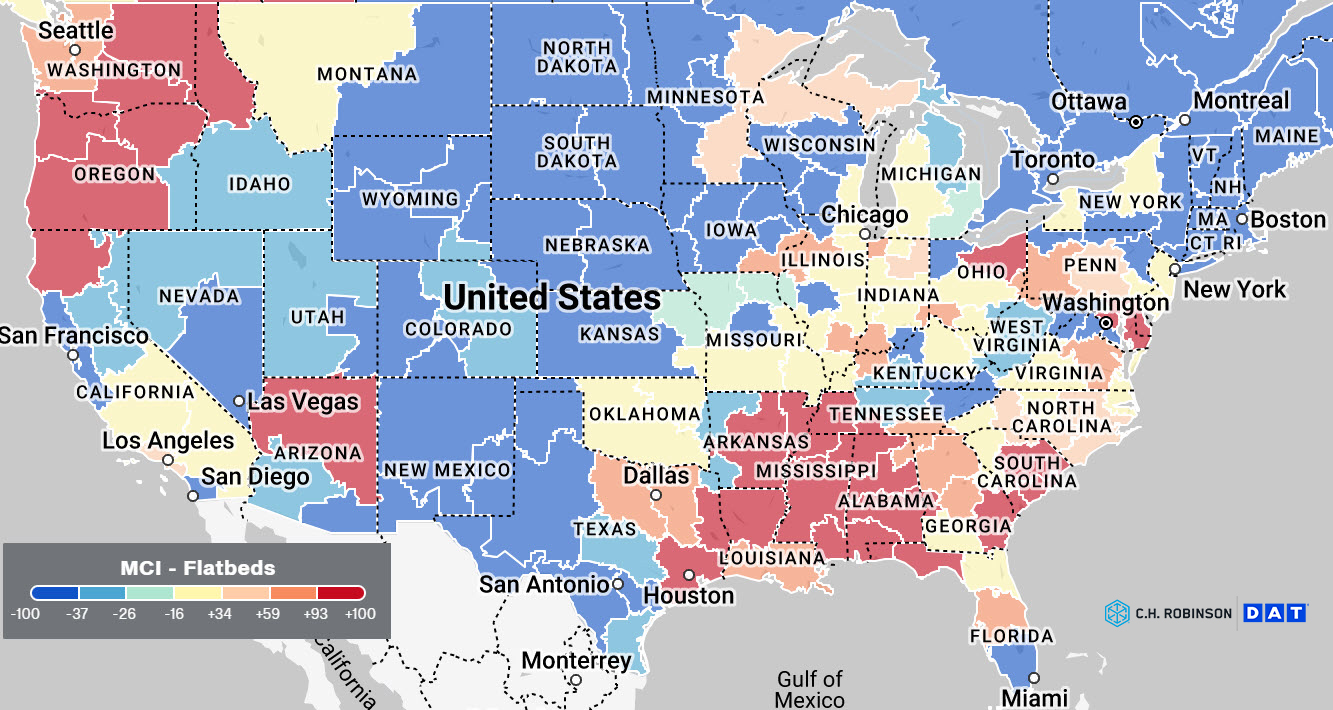
Today’s flatbed spot market LTR continues to show prolonged regional tension in the south from Texas, eastward. Broadly, the flatbed market offers plentiful capacity for spot and contract services nationwide. Week 32 LTR's were 5.6:1 with a five-year national average of 23:1.
TOP STORY: Yellow Freight Market Insights
Operations have been suspended and on Sunday August 6th, Yellow Freight filed Chapter 11 bankruptcy. Yellow discontinued accepting freight before shutting down, in an effort to deliver the freight within its network. A small percentage of their daily volume was not delivered before the final day of operations and terminals are offering some operations to allow for rescuing the final shipments in their network. We recommend making appointments with terminals before sending in a truck to pick up shipments.
Many of Yellow's terminals were owned by other carriers and leased back to Yellow. In some of these situations, the terminal owners may work quickly to convert the terminal into their operations to help address the influx of freight that was formerly Yellow.
LTL carriers offering national services were able to absorb much of the Yellow volume. These initial carrier selections are not necessarily proving to serve as the permanent routing, as regional carriers are likely to see additional volumes awarded.
Freight volume embargos
The shift of Yellow freight to other carriers taxed some carriers and regions more than others. As such, some carriers have issued embargos on additional freight for certain terminals due to lack of capacity. The longevity of the embargos is uncertain, but we might advise our clients to expect them to last through September.
Mergers and Acquisitions
Consolidation continues in this trucking segment with following most recent changes:
- Clear Lane will be operating under Frontline this month. Both Frontline and Clear Lane are owned by STG logistics.
- Express 2000 was acquired by Cross Country last week
- We can expect at least one more M&A in 2023 from a larger regional carrier working towards nationwide presence
Pricing insights
General Rate Increases (GRI) increases
- August offered six out of cycle GRI's with 10 of the top 20 carriers issuing General Participation GRI’s, some were out of cycle and some their yearly adjustments.
- Increases range from 4%-31% overall increase
- Average increase for all carriers is 10% overall increase
- These increases are a reminder of what transpired during the pandemic
- Pricing discipline continues to be a major factor. Carriers are advising shippers that large quantities of additional new/unfamiliar freight may not move under existing general pricing. Proposals and negotiations are common as freight continues to search for its best next alternative to Yellow
Shown below is the total parcel revenue from carrier public records and CHR estimate of regional carriers
The pandemic period brought a spike of parcel that triggered a volume shift from B2B to greater B2C and advanced the online consumer shopping mindset perhaps up to 7 years.
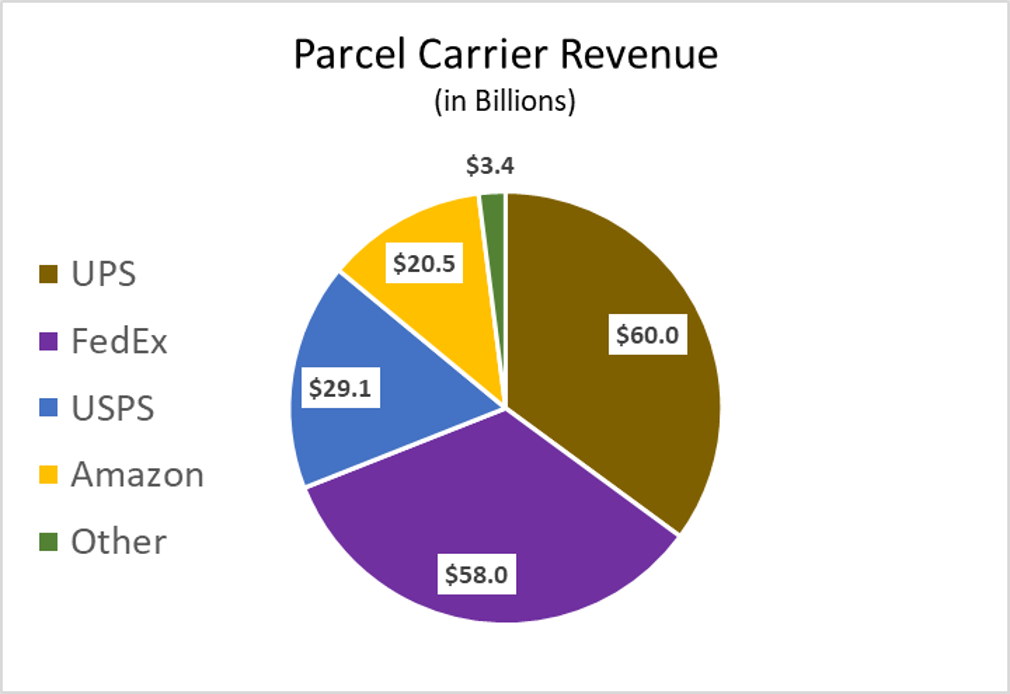
Source: Statista.com
As a result of increased B2C, the average package size dropped and there was additional drift from LTL to parcel as some segments with LTL saw shipment sizes decline. As a result, carriers are imposing accessorial charges to avoid undesirable freight
The regional carrier community (presented as 'other' in the graphic above) is taking advantage of the UPS and FedEx intentional strategies to decline servicing undesirable parcels.
Market share by revenue is showing interesting evolution of the industry when comparing 2022 to 2010. The USPS package volume is growing, while total revenue is as a percent of the market is largely unchanged. UPS efforts in 2022 to strategically decline offering service in some B2C areas materially reduced their market share by revenue and FedEx picked up a meaningful increase over those years.
In 2023 shippers are likely focusing on risk mitigation in their parcel supply chain. Some shippers made an immediate shift to FedEx during the UPS labor negotiations and perhaps plan to keep a portion of their volume in the FedEx network long term. Additional diversification such as shifting to regional carriers is a strategy that takes a bit more time to implement and we anticipate seeing that shift growing throughout the rest of the year. Additionally, experts anticipate that UPS will need to raise pricing by ~8% + to offset the cost of the new labor agreement. If and how they make that rate change for 2024 (FedEx will likely make a similar move) could impact which parcels shippers consider moving away from Nationals and into regional carriers.
TOP STORY: Now is the time to develop an intermodal strategy
Intermodal domestic volumes have stabilized. North American domestic volumes appear to be gathering upward momentum as volumes rise slightly above seasonal trends for the second month in a row. Volumes are forecasting to increase month over month building into a muted peak season. We expect to see a dip in overall volumes in the July data as we see impacts from the Canadian ILWU strike.
While volumes remain down Y/Y, there are no capacity-constrained domestic container markets. Now that drayage and rail capacity are abundant it is a perfect time to look at solutions that did not fit as well in the past. A number of new domestic north American options have come into offer this year.
Spot rail pricing tends to lag truck pricing by four to six weeks and is now near 30% lower Y/Y. The pace of decline appears to be slowing, as we may have reached a bottom on this cycle. The lower cost of diesel is applied additional pressure to IMDL savings. However, with diesel price increases pricing pressure could be lessened. Contractual rates while still down are normalizing.
FTR's pricing pressure index projects a slight recovery in rates during the peak season and contracted rates are forecasted to finish 2023 at an average of -2.8% Y/Y. The rails are still offering discounts in historically deficit markets. Making commitments now in markets like southern California and outbound Mexico will result in lower rates and favorable capacity allocation agreements before the market shifts back to historic norms.
Now is the time to update expected rail transit times. The transit times have normalized above averages. This may make the rail better positioned to support your supply chain needs. This is especially true on any containers riding the CPKC. Additionally, expedited service options provide savings with similar speeds to over the road in many lanes.
The railroads are looking for unique solutions to get more containers on their networks. Set your strategy for 2024 now.
Explore all market insights
- North American Freight Market Insights
- Global Freight Market Insights
- North American Trade & Tariff Insights
Get the latest market updates delivered to your inbox
Let Our Insights work for you
Our experts will guide you through the current landscape. Start with a free Consultation