December 2023 North American Freight Market Updates
Updated December 4, 2023
Customize and download this report
This is an awesome market update
This is a test to validate what goes into this space
TOP STORY: The factors currently supporting LTL pricing
Today, the less than truckload (LTL) industry continues to rapidly adopt technology, focuses on pricing disciplines, and faces some physical capacity limitations.
These realities mean today’s participants must be well versed on the market conditions, know what services are available, and engage the full breadth of LTL services—from traditional LTL common carriers to the hybrid consolidation solutions.
Where the truckload market has hundreds of thousands of carriers, the LTL market demographics are vastly different. In fact, there has been significant consolidation of LTL carriers over the past 30 years. A recent wave of acquisitions is further evolving the LTL marketplace.
The image below shows a summary of the LTL market with approximately 91% of LTL revenues being managed by 25 LTL carriers.
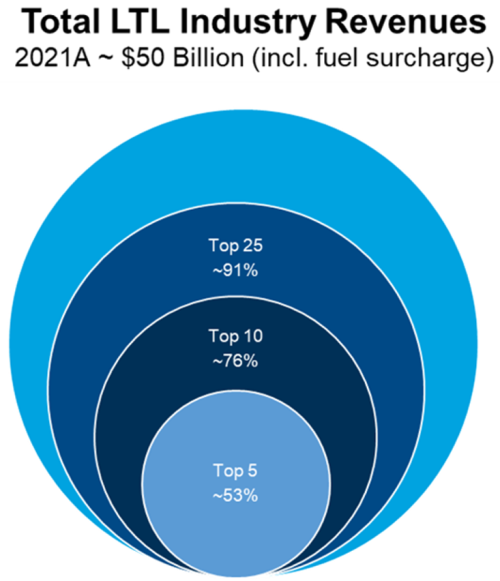
Source: C.H. Robinson research and figure
While the market offers ~110 carriers, their services vary by market and lane. To successfully secure LTL capacity nationwide, shippers require a strategic approach that optimizes the breadth of the market.
Capacity expansion—in the form of more crossdocks and new carrier entrants—is constrained by the capital-intensive reality of this mode that includes brick and mortar terminals.
Truck and labor challenges along with mergers, acquisitions, and bankruptcies have further contributed to the shape and overall capacity of the LTL market.
During 2021, ACT Research estimates the LTL industry experienced a 9% surge of tonnage as well as strong volume growth. These surges were a result of economic stimulus packages combined with the rapidly expanding popularity of ecommerce retail shopping. This growth followed volume and tonnage declines in both 2019 and 2020.
Tonnage and terminal changes
LTL is very asset-intensive and depends on costly crossdock infrastructure that takes years to build and expand in a material way. The table below shows insights on tonnage and terminal changes between 2019 and 2022.
| Tonnage insightsi | Capacity insights (crossdock terminal capacity)ii | ||
|---|---|---|---|
| ↓2019/2020 | low-mid single digit declines Y/Y | ↓ 2019/2020 | 1–2% capacity decrease each year |
| ↑ 2021 | 9% increase Y/Y | — 2021 | Flat capacity year |
| ↓ 2022 | Estimated -3% from 2021 | ↑ 2022 | Estimated +2% from 2021 |
| ↓ 2023 | Forecast: -3% from 2022 | ↑ 2023 | Forecast: +1–2% from 2022 |
The above table suggests the possibility of capacity and tonnage/volume balancing as early as 2023.
For further perspective on the balance of volume/tonnage and capacity in the LTL sector, consider a longer-term view. Estimates from Wolfe Research suggest that terminal counts for public LTL carriers have declined roughly 10% from 2010. Of the 16 years from 2007 to 2022, 12 have seen contracting or flat LTL capacity, with estimates for 2021 roughly flat and 2022 reflecting ~2% growth. The table below offers more detail.
2007 to 2022 LTL insights
| Tonnage/shipmentsiv | Terminal growth/contractionv | ||
|---|---|---|---|
| 2007–2008 | Largest LTL years | 2007–2022 | 4 of 16 years expanded |
| +7.6% tonnage avg. over 2009-2021 | 12 of 16 years contracted/flat | ||
| +11% shipments avg. over 2009-2021 | 2010–2022 | Terminal capacity decreased ~10% | |
| 2009–2021 | Steady growth trend | Terminal capacity expansion estimated at ~2% in 2022 | |
| 17% more tonnage in 2021 over 2009 | |||
| 10% more volume in 2021 over 2009 | |||
| 2006–2008 showed LTL spikes, 2009 was materially lower, with steady growth since | |||
Because terminals closed by public LTL carriers can still be used by private LTL carriers, truckload carriers, or other logistics providers, there could be a net no change in market capacity. As such, be sure to reassess your carrier diversity strategy so it respects this shift and the possible loss of capacity.
LTL carriers are publishing general rate increases (GRIs) around 5%. Actual pricing budgets will be dependent on the freight attributes, carriers, and modal strategies employed. Some lanes will take larger increases, while others may offer some savings.
Use this long-term perspective to help understand the selective freight strategies and pricing disciplines of LTL carriers. Keep in mind they are working to increase yield in a constrained terminal environment. Accordingly, LTL carriers will continue with highly disciplined pricing, despite the decelerating tonnage and volume forecasts for 2023.
Based on today’s economic environment and the forecast for 2023, opportunity exists for capacity availability and pricing flexibility in some lanes.
Keep in mind, the forecasted terminal capacity growth, similar to recent years, is not equitable across all LTL carriers and markets. Some carriers are rationalizing terminal infrastructure (closing terminals) while others are expanding existing facilities or opening additional service centers. Most carrier expansion is within existing service areas versus adding territory coverage.
With so much evolution in the LTL industry, many companies face the same challenges. Here are answers to some of the most common questions about the LTL market:
Q: With the shifting economy and declining LTL tonnage volumes being reported by carriers, can I expect meaningful pricing reductions?
A: Carriers report they will continue with disciplined pricing in 2023. As LTL is different from the truckload marketplace, there are more associated costs. LTL operating costs are not going down. Prices for trailers, tractors, maintenance, real estate, insurance, and wages continue to increase with no signs of going down in 2023.
Q: How should we plan for year over year (Y/Y) LTL pricing forecasts for 2023?
A: Aggregate LTL pricing forecasts from analysts range from -3% to 1% Y/Y. With that perspective, expect your portfolio of LTL freight to have some shipments and lanes that will cost less and some that will cost more than this range.
Key LTL shipment attributes such as the chosen carrier’s need for freight in a lane, or the primary shipment attributes of density, dimensions, and value will influence the Y/Y change in price. Special attributes such as overdimensional, hazardous materials, and lift gate service will continue to be very influential on pricing and accessorial charges.
Properly managing your budget will depend on a thorough study of your freight’s key attributes and discerning if amendments to the carrier portfolio and mode strategy can offer a more favorable cost or service forecast.
Q: Is it a good time to take our business out to bid?
A: This depends on the age of pricing, mix of freight characteristics, and how well the freight aligns with your carriers’ networks. Review the "LTL freight in 2023" section below for further considerations that can help improve pricing and service the coming year.
Because LTL carriers operate quite differently from truckload carriers, five of the top LTL carriers in the United States offer insights that can help transportation teams start productive LTL carrier conversations.
Q: What attributes make LTL freight most attractive?
A: The ideal LTL freight is properly packaged (covered or created with no product exposure), made up of pallets <50″ tall and <48″ wide to maximize cube. Who the consignee is also matters as well as if there is volume to support drop trailer service.
Q: Will accessorial charges for extra length and overdimensional shipments relax?
A: There are no indications overdimensional or extra-long fees will diminish in 2023 at the industry level. Individual carriers may offer reductions in exchange for a portfolio of more desirable freight.
Q: What are the limitations to expanding capacity?
A: The primary limitation to expanded capacity for the LTL industry is terminal growth. Many/most terminals are in densely populated areas and lack the real estate to expand. Most areas where terminal expansion are needed face population, government, and environmental pressure against further expansion. These pressures and the costs and timelines for capital expansion limit the speed carriers can expand to meet market opportunity.
Q: Why are dimensionalizers and density pricing attractive to LTL carriers?
A: The move to density pricing with the help of dimensionalizers is helping to correctly price freight/shipments by their contribution to yield. It is a more accurate approach to consolidated load building, cost, and pricing. This evolution helps carriers discern what freight creates value in their network and what freight does not.
Q: Do you plan to contract/expand capacity in 2023?
A: The years of 2021/2022 were big for expansion of LTL capacity. In 2023, the focus will be on updating existing facilities to support expanded capacity.
With an LTL market that will continue a very disciplined approach to freight selection and pricing, use these questions to reflect on your LTL strategy and budgeting:
- Are shipment accessorial charges for lift gates, appointments, and extra charges for some pick/delivery areas after the shipment event?
- Does my capacity strategy reflect the needed diversification of today's LTL market?
- Do I have distinct strategies for my regional and national freight?
- Am I offering a quality driver experience with quicker access to dock resources, shorter dwell time, and the opportunity to be on the loading dock?
If the answer to one or more of these question is “no,” consider optimizing your shipping strategy for the year ahead. The results can help ensure your portfolio of LTL freight has the most sustainable strategy for price and service.
LTL carriers are publishing GRI's (General Rate Increases) around the 5% level. Actual pricing budgets will be dependent on the freight attributes, carrier and modal strategies employed. Some lanes will take larger increases, while others may offer some savings.
Within this LTL market insight summary, we offer some strategies that can bring some value to pricing and service. Please contact your C.H. Robinson representative to learn more about a capacity planning engagement. The results of this engagement process will help a business ensure your portfolio of LTL freight has the most sustainable strategy for price and service.
TOP STORY: Capacity contraction update
With an over supplied market at the bottom of the cycle and spot market pricing at the estimated cost to operate a truck, contraction of capacity typically follows. Here is a top line update on the early stages of the carrier community response to the oversupplied market:
| ~ (12,624) | Fewer active for-hire USA truck lines YTD June | The number of carriers with revoked operating authority minus new carrier creation. ~80% of net revocations are owner-operators, with the balance mostly small carriers. Source: C.H. Robinson analysis of FMCSA carrier registration data Jan-June 2023 |
| (8,800) | Fewer Long Haul Truckload trucking jobs Q1 2023 | For trucking fleets with drivers on the payroll. Q2 BLS figures are still preliminary. Source: Bureau of Labor Statistics, Current Employment Statistics (BLS-CES) |
| ~ (13,770) | Net USA for-hire USA truckload fleet contraction Q1 2023 | The sum of lost truckload capacity across owner-operators and fleets, directionally helpful but not precise. Preliminary May figures showed 2,400 new long-haul trucking jobs, which is counter to four months of decline and will be adjusted when June figures are published. Source: BLS |
*Net fleet contraction estimates are pulled from FMCSA registration data monthly. CHR analysis after filtering to class 8 for-hire fleets. Considered directionally accurate vs. precisely accurate.
The market is seemingly responding to oversupply and depressed pricing. Carrier count reductions are largely a product of owner operators discontinuing active operation, perhaps parking their truck and taking on other employment. There are some smaller carriers who have discontinued operations and a small number of fleet acquisitions that have removed them from the trucking company count.
Fleets appear to be getting a bit smaller based on BLS employment statistics. In Q1, publicly traded fleets contracted active fleet size by about 1.6%.
Participants in the USA for-hire trucking market should continue to watch the evolution of the for-hire active capacity against the evolving economic and freight volume conditions when planning for the second half of 2023, as well as when looking to 2024. The market is starting its phase of working toward balance, a better pricing environment, and profitability that supports investment and growth. In the meantime, capacity is plentiful and it is a great time to meet with your C.H. Robinson representative for today's needs, and to set a capacity strategy for the next up-cycle.
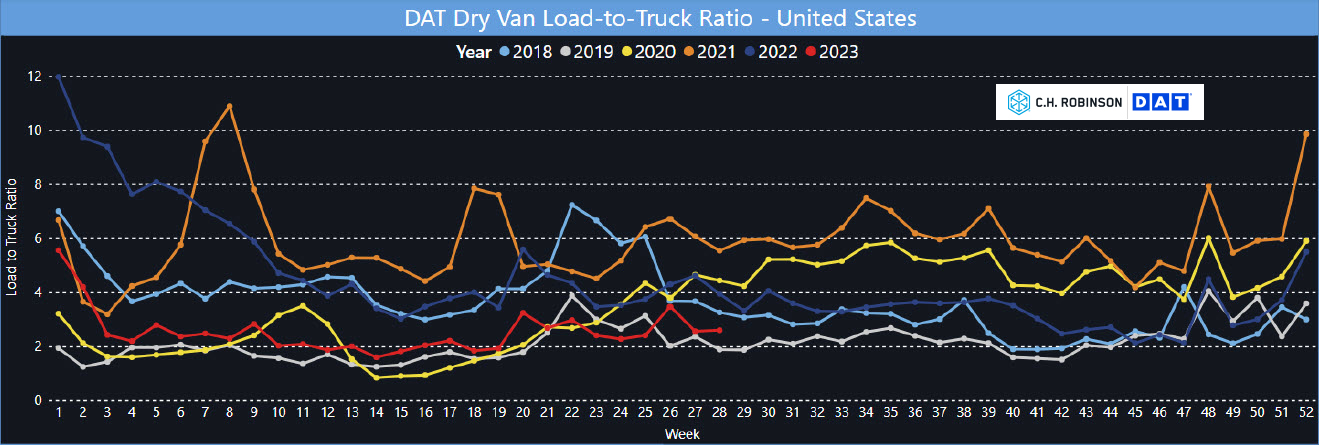
Dry van is the largest segment of the truck market. It is often the primary reference for the U.S. truckload market’s performance. For context, the dry van spot market has been followed the somewhat normal seasonal tightening before the American Independence Day holiday on July 4, followed by normal seasonal softening post-holiday. Load to truck ratios (LTR) are still below the five-year averages of ~4:1, but more balanced than they have been for some time.
Shown here is the nationwide U.S. DAT LTR for dry van spot market for the years 2018 through 2022 and the first 28 weeks of 2023 plotted in red. Week 28 LTR was 2.6:1 and the five-year average was 4.2:1. It seems likely this market will moderate a bit in this range for the near term.
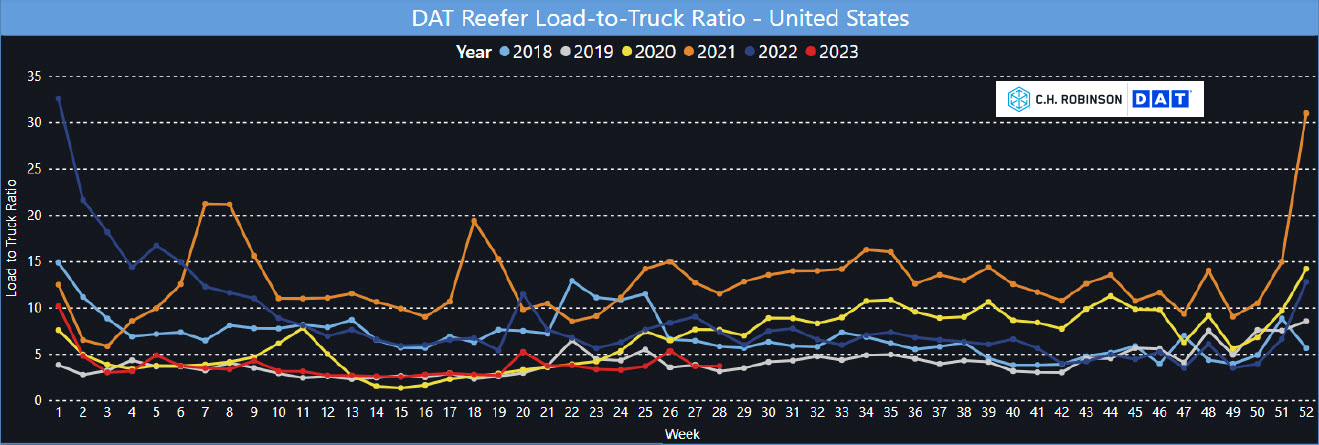
Refrigerated truckload currently displays a rather stable national average LTR with limited seasonal and regional pressures related to the harvest of fresh produce in the Southern and western United States. This year is likely not to face the same historical produce season tensions due to the level of available capacity. Week 28 was 3.8 against the five-year average of 7.8:1
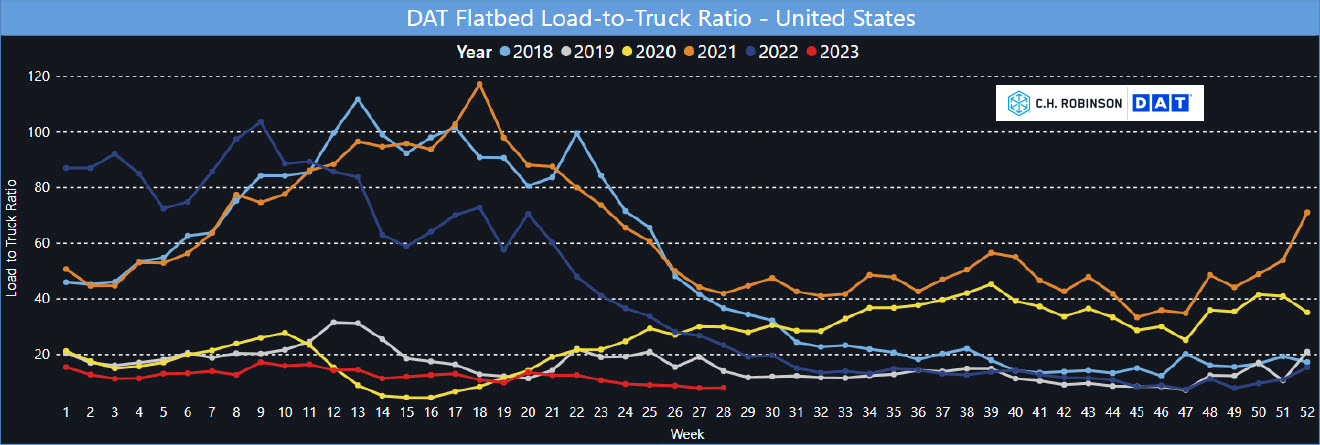
Today’s flatbed spot market continues to offer plentiful capacity in most markets with LTRs well below historical averages and spot and contract pricing closely aligned. The Southeast has continued as the only region displaying any sense of market balance for flatbed. Week 27 load to truck ratios were 8:1 against the five-year average of 31:1.
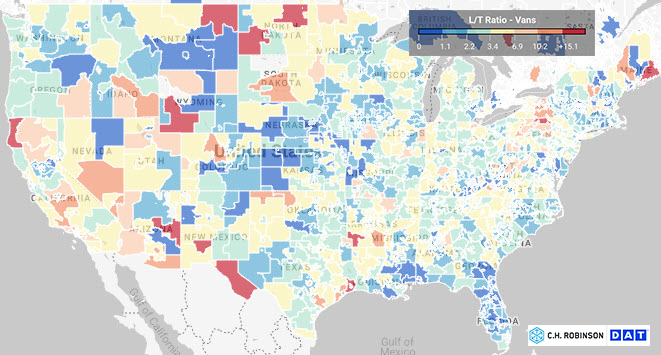
National averages are helpful for aggregate perspectives of the market. Trucking, however, is a very regional business. Each week displays the varying experience of the trucking market. Shown below is week 28, July 9-15, 2023.
Some markets are in balance, while others may be over or undersupplied, and other markets may have little trade and freight. The freight experience in each market influences truckload capacity strategy and that experience will vary with annual cycles.
Sponsored research by CHR with MIT's Center for Transportation and Logistics has shown that there are four primary market segments. Those being 'balanced' trade corridors, 'headhaul' corridors, 'backhaul' corridors and 'sparce' corridors. Shipper freight attributes combined with the market segment capabilities shape capacity strategies from committed to spot market strategies. Connect with your C.H. Robinson representative to learn more about our Procure IQTM experience and our researched insights that can help develop a more capable truckload strategy.
Dry van displays a low level of tension across the United States. The produce season impact in FL and Southern GA has subsided, with an uptick shown in Southern CA.
The national average is 2.6:1 against a five-year average around 4.2:1. Broadly speaking, spot market capacity is readily available in all markets when a day's lead time is offered.
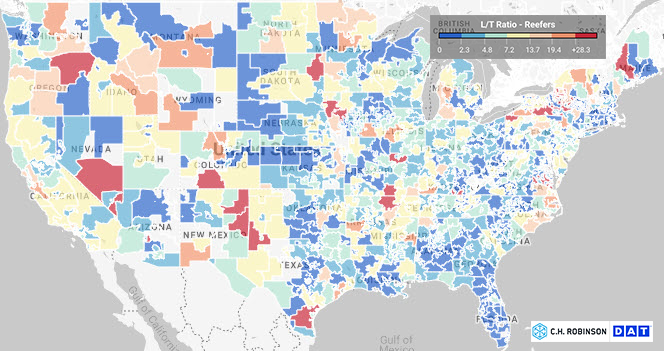
Note the level of available capacity this year is plentiful, leaving the produce growing regions well supported. Produce growing markets at this time of year are The Southeast, Southern CA, Texas valley and Norther Mexico. National LTR average for week 28 was 3.8:1 range against a five-year average around 7.8:1.
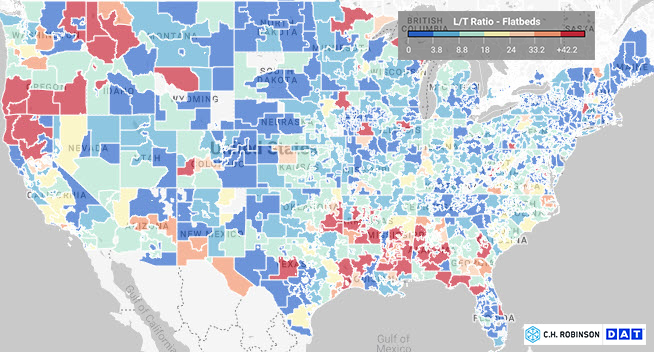
Today’s flatbed spot market LTR continues to show prolonged regional tension in the south from Texas, eastward. Broadly, the flatbed market offers plentiful capacity for spot and contract services nationwide. Week 28 LTR's were 8:1 with a five-year national average of 31:1.
TOP STORY: Capacity is available and carriers continue to be selective with freight
Yellow labor situation
In the wake of LTL carrier Yellow making the strategic decision to preserve cash by pausing healthcare and pension contributions that were due July 15, their Teamster drivers have indicated they may strike as soon as Monday, July 24. The situation is fluid and C.H. Robinson is in close contact with Yellow leadership in order to keep our customers informed. We are proactively working with customers to provide contingency plans and reporting and analytics on alternate carrier routing and potential cost implications. As one of the largest third-party LTL shippers in North America, we offer a wide array of capacity solutions. See the government section at the end of this report for additional insights about federal government involvement in labor disputes, and call your C.H. Robinson rep for the latest information as events unfold.
Market Capacity
Capacity is broadly available, but a starkly different situation than truckload. Most analysts feel that the LTL market has the ability to absorb any migration of Yellow volume. Due to the level of balance in the LTL industry however, should the industry need to absorb all of Yellow's volume, it is expected that this will further strengthen the LTL carrier community pricing power and disciplines.
Terminal capacity continues to evolve with some carriers like AAA Cooper opening 11 terminals in 2023 and other carriers like Yellow and T-Force rationalizing their network terminals.
E-Bills of Lading
LTL carriers and C.H. Robinson continue to focus on converting from paper to eBOL's. Please connect with your C.H. Robinson representative to discern the opportunities and benefits for your LTL business.
Ongoing negotiations between UPS and the Teamsters Union have reached a critical point, with a potential nationwide strike authorized by 340,000 UPS drivers and package handlers. The strike could begin as early as August 1 if the two sides don't reach an agreement on the remaining concerns.
FedEx is positioning itself to handle any overflow of business. The company has set pricing deadlines and issued a press release encouraging UPS customers to switch to its services.
Here's a summary of the two developments:
- 55 non-economic issues agreed upon as of July 1
- Teamsters authorized a strike vote with 97% of participants voting yes, if an agreement is not reached by the expiration of current contract on July 31st
- Sean O’Brian, President of the Teamsters, has said the Teamsters will not work past the current agreement without a new ratified agreement being agreed upon
- Strike declared "imminent" on June 28 by Teamsters when UPS did not bring a best and final offer by July 5th
- UPS has started continuity training for management and other workers not covered by the Teamsters agreement. UPS starts business continuity training
- Teamsters have indicated they may continue to work as long as a tentative agreement is reached, but not yet ratified.
- Sean O’Brian has asked the White House not to intervene if a strike happens. UPS Union asks White House not to intervene if strike happens | WZZM
- On 7/19 UPS announced it is prepared to improve its economic package to the teamsters. The parties are expected to start negotiating again next week, after a two and a half week break. UPS to sweeten deal as Teamsters-represented workers prepare to strike | Reuters
UPS, Teamsters accuse each other of walking away from contract talks | Reuters
FedEx's Actions Amid Standoff: FedEx details capacity plan as UPS strike fears intensify | Supply Chain Dive
- Pricing offers for large customers need to be signed by July 17
- The week of July 17th will be used for baseline volume in the FedEx network to determine capacity
- Commitments to large customers onboarding after the deadline will not be honored
- New small to midsize customers will be accepted based on network capacity
Your C.H. Robinson parcel representative is available for questions and carrier diversification strategies across the portfolio of regional and national carriers.
Please also see the government section at the end of this report for additional insights about federal government involvement in labor disputes.
TOP STORY: Domestic intermodal market at bottom
Intermodal domestic volumes have stabilized but have not yet started to recover. The market has also shown signs of returning to regular seasonal patterns. Volumes are forecasted to increase month over month, building into a muted peak season.
There are no capacity-constraints on domestic container markets. With drayage and rail capacity being abundant, now is a perfect time to consider intermodal solutions that were not available in recent years. A number of new domestic north American options have come to market this year.
Spot rail pricing tends to lag truck pricing by four to six weeks and is now near 28% lower Y/Y. The pace of decline appears to be slowing, as the market may have reached a bottom on this cycle. The lower cost of diesel is unfavorably influencing how intermodal savings appear to truckload due to how fuel surcharges are calculated.
Contractual rates, while still down, are normalizing. Demonstrating more strength than the spot market.
FTR's pricing pressure index projects a slight recovery in rates during the peak season and contracted rates are forecasted to finish 2023 at an average of -2.8% Y/Y. The railroads are still offering discounts in historically volume deficit markets. Making commitments now in markets like southern California and outbound Mexico will result in lower rates and favorable capacity allocation agreements before the market shifts back to historic norms.
Now is the time to update expected rail transit times. The transit times have normalized above averages. This may make the rail better positioned to support your supply chain needs. This is especially true on any containers riding the CPKC. Additionally, expedited service options provide savings with similar speeds to over the road in many lanes.
- Jan 2024 North American Freight Market Updates
- December 2023 North American Freight Market Updates
- November 2023 North American Freight Market Updates
- October 2023 North American Freight Market Updates
Explore all market insights
- North American Freight Market Insights
- Global Freight Market Insights
- North American Trade & Tariff Insights
Get the latest market updates delivered to your inbox
Let Our Insights work for you
Our experts will guide you through the current landscape. Start with a free Consultation