Global Freight Market Insights
Impact your business with timely information on global freight trends that could affect capacity availability, pricing, and more. Create and download custom reports by adding your preferred ocean and air trade lanes—then, check back monthly for updates.
-

-

-

-

-
Copy to clipboardCopy to clipboardLink Copied
Updated on December 21, 2023
The following information is built on market data from public sources and C.H. Robinson’s information advantage—based on our experience, data, and scale. Use these insights to stay informed, assist with decision making to potentially mitigate risk, and hopefully help avoid disruptions to your supply chain.
Customize and download this report
Select the topics you would like to export:
Explore all market insights
- North American Freight Market Insights
- Global Freight Market Insights
- North American Trade & Tariff Insights
Global Market Overview

Rising concerns about global warming and climate change has prompted the EU to make a collective effort addressing environmental challenges. Initiated in 2005, the EU Emission Trading System (ETS) is a market-driven mechanism designed to combat climate change by encouraging entities to reduce GHG emissions.
The ETS is aligned with the EU's goal to achieve carbon neutrality by 2050 and a 50% reduction in greenhouse gas emissions by 2030. The effort operates on a 'cap-and-trade' principle, progressively limiting the total allowable emissions.
Already encompassing over 11,000 installations such as power stations, steel producers, and chemical plants, as well as airlines within the European Economic Area (EEA), beginning January 1, 2024, the EU ETS will include the shipping industry, which is a significant contributor to greenhouse gas (GHG) emissions.
This extension, formally adopted in May 2023, will result in new carbon taxes affecting all shipping customers involved in transporting goods to, from, and within the EEA.
Under the EU ETS, carbon pricing is calculated based on vessels rather than cargo. Ship operators are required to report emissions and allocate allowances for each ton of CO2 generated. The applicable range of EU ETS differs depending on the calling ports of each service, and transshipment port protection measures are applied to neighboring non-EU ports within 300 nautical miles of an EU port if container handling at that port is more than 65% transshipped.
Emissions in the geographical scope of the EU ETS for shipping are as follows:
- 50% of CO2 emissions from voyages between an EU/EEA port and a non-EU/EEA port
- 100% of CO2 emissions from voyages between the EU/EEA ports
- 100% of CO2 emissions while at berth in EU/EEA ports

The carbon pricing increase will be phased in over three years, with companies submitting allowances for a greater percentage of emissions each year:
- 2024: 40% of verified emissions
- 2025: 70% of verified emissions
- 2026 and on: 100% of verified emissions
European Union Allowances (EUA) must be purchased and submitted annually.
Ocean carriers are implementing an ETS surcharge to cover the CO2 charge of shipping in the EU. Calculations per TEU will be based on the Clean Cargo methodology for CO2 multiplied by the market price for EUAs from the ICEDEU3 Index, updated quarterly. The ETS Surcharge, which varies depending on the trade lane, equipment time, and size, will become applicable for all cargo moving from, to or via Europe effective January 1, 2024.
Get help navigating the impact of the EU ETS—connect with our experts today.
Get the latest market updates delivered to your inbox
Thank you for signing up for the global freight market updates from C.H. Robinson. Read our global privacy notice.
Committed to Sustainability Webinar
See what it takes to measure and optimize your transportation emissions.
Air Freight Update
Seasonal demand, in large part made up of ecommerce goods, is expected to continue into late December. This will likely cause elevated general market rates. Capacity is tightening in certain areas, namely China, with other parts of the Asia region are not experiencing the issue as much, aside from the normal end of the year increase in demand. Capacity, rates, and demand are expected to normalize as 2024 begins.
Current market conditions across various regions show strain, characterized by tight capacity and mid-level spot market rates. In Africa, capacity remains flat month over month, contributing to limited options and a notable backlog for exports from Brazil due to airport terminal congestion.
LATAM to Asia experiences similar conditions. There is a downward trend in capacity and spot rates, driven by high demand during fruit season from Chile and Argentina to Asia, are rising. This is amplifying the export backlog from Brazil.
Though capacity is flat month over month, LATAM to Europe faces capacity constraints and rising spot rates. This impacts the ability to secure space for general cargo amid some regular perishables going into the region.
The Middle East encounters limited options and potential challenges in securing space for general cargo as tight capacity persists. There is greater demand for shipments to North America during the fruit season from Chile and Argentina into North America destinations, contributing to tight capacity and rising spot rates.
Latin America to Oceania has very limited options amid tight capacity and escalating spot rates. South Asia is undergoing a decline in capacity and heightened spot rates, especially driven by the fruit season demand from Chile and Argentina into Asia destinations.
Across these regions, a common challenge emerges with a backlog for exports from Brazil due to airport terminal congestion. If anything, it underscores the need for strategic solutions to effectively navigate the strained market conditions.
The U.S. export market is stable as demand remains low relative to capacity. Capacity is generally available globally with few exceptions.
U.S. imports continue to experience stronger demand from Asia during peak season than during the summer months. The record-setting November snowstorms in Alaska created a backlog that has yet to be fully cleared out.
Ecommerce demand has been the primary driver and should slow to some degree as the holidays approach. Since airlines will adjust capacity with demand, rates are likely to remain elevated through year end.
The Trans-Atlantic market has tightened in recent weeks as demand increases. The loss of capacity during the winter schedule is being felt in this market with spot market rates trending up. This condition will persist as long as demand remains elevated—expect relief in January.
The market is expected to return to pre-pandemic conditions in the first quarter of 2024. Capacity to Oceania continues to grow, and demand is softer than typical at this time of year.
For our inbound markets, demand is more than accounted for by available capacity. Outbound cargo is the same with some restricted lanes due to seasonal perishable cargo, such as stone fruit.
Since the start of December, there has been a noticeable uptick in cargo throughput within the air freight market in this region. Prices for shipping to Europe and the U.S. are rapidly rising. Securing available space is challenging, often requiring 3–4 days of lead time. The current scenario is further exacerbated by a peak situation originating from China.
Airline hubs are experiencing congestion due to the influx of high-yield cargo from China destined for the United States and Europe. Expect this challenging situation to persist until the end of the December—potentially continuing until the Chinese New Year.
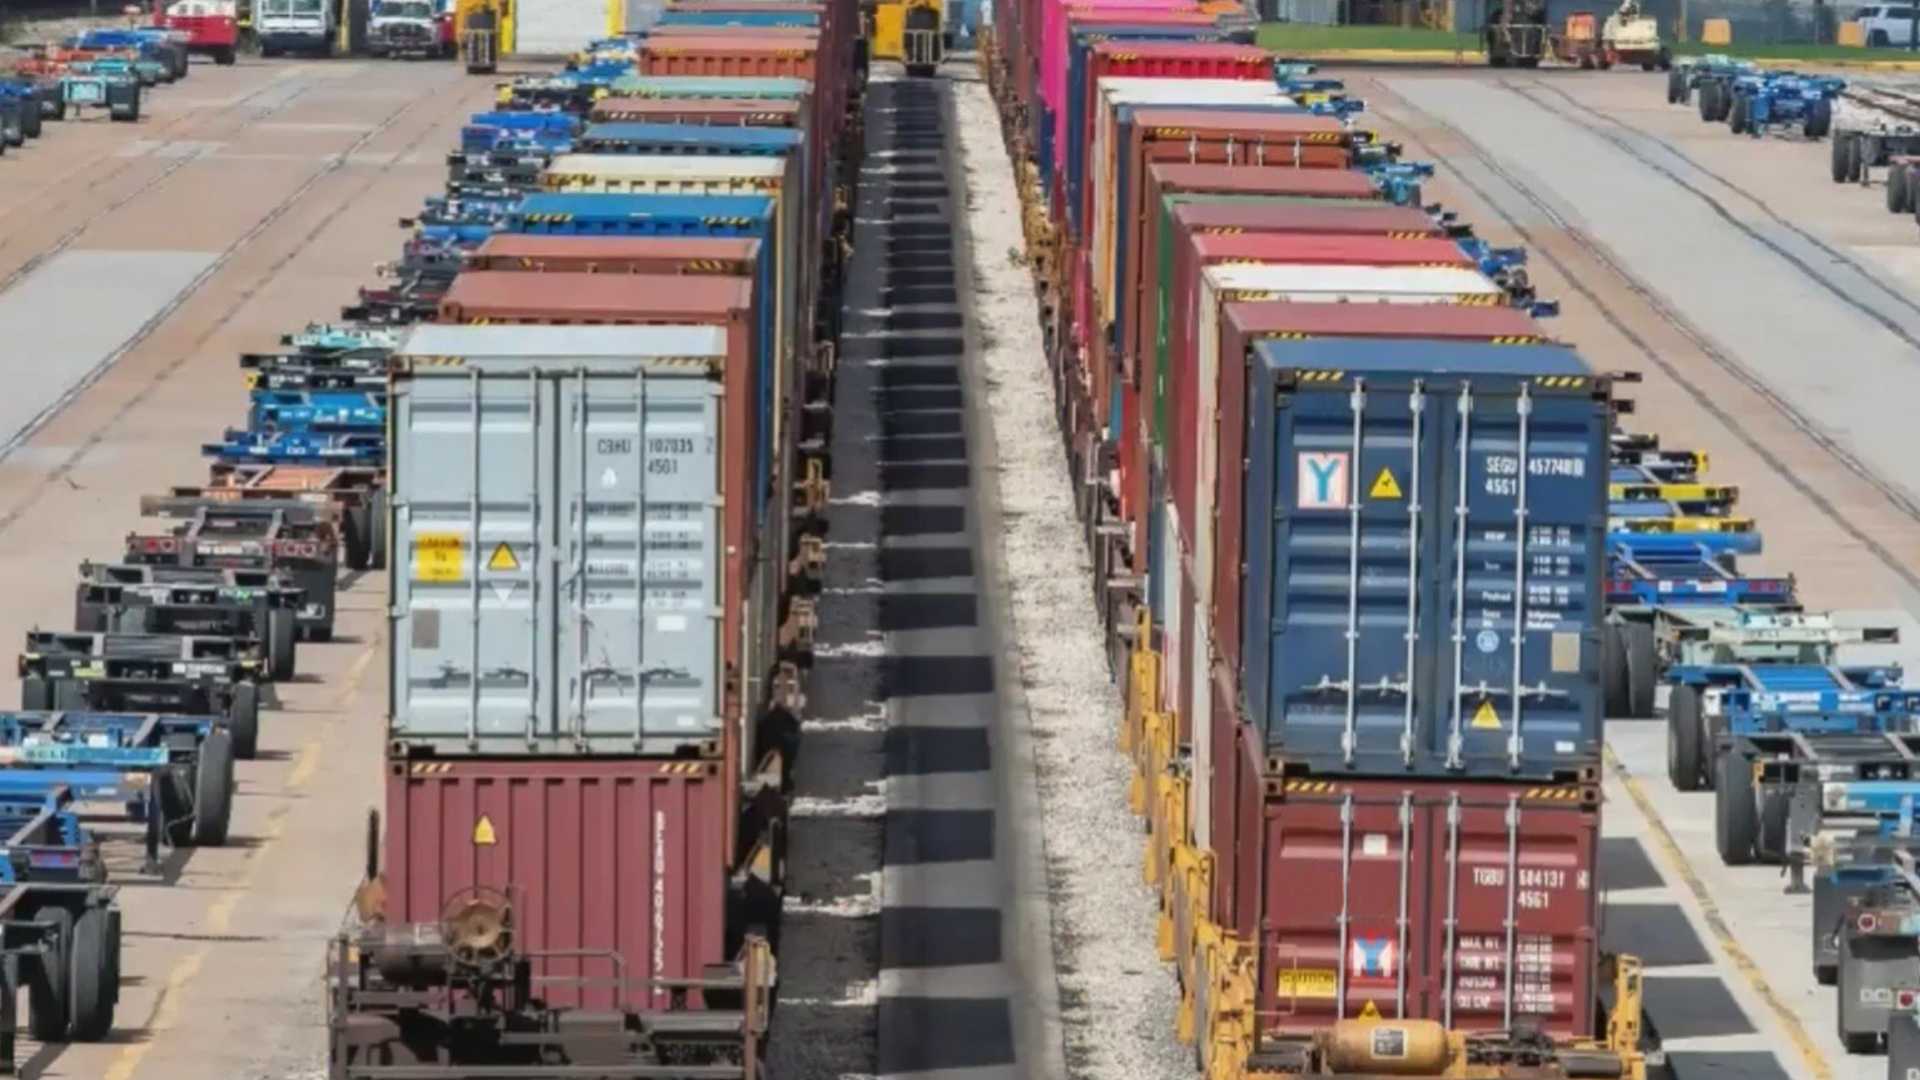
Ocean Freight Update
Ocean freight demand on most trade lanes is not meaningfully increasing, and space continues to trend higher than demand. In parallel, additional capacity continues to be added to the global fleet as the record number of new vessels ordered by steamship lines over the past few years continue to get delivered.
However, the current low water level of the Panama Canal, and its effect on capacity, is another reminder of how external events impact the industry. More details on this to follow.
Rate gains on shipments traveling from Asia to Europe are likely to hold for the month of December due to stronger capacity utilization supported by traditional year-end cargo demand.
Trans-Pacific rates are not holding as strong due disruptions at the Panama Canal, which affected the East Coast. THE Alliance carriers have been forced to divert all three of their Panama all-water services to avoid lengthy delays at the Canal.
Due to the Panama disruptions and more backhaul moves, Asia–Europe and U.S. East Coast (USEC) routings via the Cape of Good Hope have helped partially mitigate the continual new vessel deliveries with the run rate maintained at over 200,000 TEUs a month, after taking into account the deletion of older ships from scrapping.
The extension of EU ETS limitations on ocean shipping starting January 1, 2024, is by far the largest disruption for this region. Read this month’s top story above for more details on this topic and its potential impact on your business.
Be sure to work closely with your C.H. Robinson representative to navigate these changes.
Due to low water levels, the Canal Authority has incrementally limited the number of vessels transiting through the canal per day. By February 2024, it is estimated only half the number of slots will remain compared to before the drought.
This creates three main challenges:
- Transit time delays: An increasing number of sailings are now routed via the Cape of Good Hope or the Suez Canal, both options increase transit time by about 14 days.
- Lack of capacity: Since more ships are needed to cover a longer route on a weekly basis, space availability on services typically routed via the Panama Canal is tightening.
- Higher rates: When capacity slides below the demand level, freight rates increase.
While the current post-pandemic market has brought relief in many aspects for shippers, it is important to keep in mind that planning and flexibility remain key to protect your supply chain.
A more rain-intensive spring has resulted in a decrease in the scheduled volumes of export fruits, reducing the projected shipments from South America to various markets. This includes a reduction in cherry volumes to be shipped, which will be lower than anticipated.
A recent study reports a remarkable 17.5% increase in available TEUs for services to the region in 2023. The total capacity of the container fleet traded to/from and within Latin America has increased by almost 562,000 TEUs in the last twelve months.
While there has been a decrease in imports to the region, the push for exports from South America to various destinations has been constant due to the seasonal commodity diversity of different countries. Shipping lines are focused on increasing volumes and offering competitive rates in the coming months if necessary.
DP World Callao has received 15 new, 100% electric cranes for the Bicentennial Dock. The cranes—3 dock cranes and 12 yard cranes—will increase the loading and unloading capacity at the terminal by 80%, reaching a total capacity of 2.7 million TEUs. This initiative will also reduce emissions by 30% as the cranes utilize 100% renewable energy.
A 20% decrease in Colombian imports means there are container imbalances for some shipping companies. Expect difficulties in replenishing empty containers for export.
The Brazilian coast is struggling with a lack of 20' containers and special equipment. Exporters' forecasts must be considered at least two weeks in advance (on average) to have equipment repositioned and available.
The summer season is impacting the ports in southern Brazil, and excessive rainfall has flooded cities in this region. Navegantes Port closed during the entire month of October, and there still is a backlog. There is no normalization foreseen to operations due to the adverse weather conditions expected.
In the north region, Manaus and Vila do Conde Ports are facing several droughts, and the water level is too low. Port capacities are reduced and ships must operate lighter than usual. Most carriers are applying the low water surcharge (LWS), and transshipping can occur.
The Port of Montréal contract expires December 31, 2024. Negotiation teams continue to discuss demands, but initial discussions are appearing unfavorable. Dock workers at the Port of Montréal are seeking wage increases of at least 20% over four years and full job security after three years.
Given the historical challenges in negotiations at this port, compounded by the recent Vancouver strike, anticipate a protracted negotiation period. As news breaks, review C.H. Robinson client advisories for more detailed information.
U.S.–Asia
- Port to port space to Asia has been more open via U.S. West Coast (USWC) ports, but there are also significant blank sailings and slow steaming due to low Trans-Pacific eastbound (TPEB) demand. Carriers have significantly increased their blank sailing program to offset the weak demand. As much as 20% of the vessel capacity has been removed in December.
- Congestion at transshipment ports in Asia remains an issue. Shipments can be delayed as much as 10–14 days at many major transshipment ports, such as Busan and Singapore. All delays at transshipment ports are leading carriers to push for business on direct services only. Congestion is expected to ease in the coming months as volumes continue to decline.
- A wave of new vessel capacity is entering the market in Q4 2023 and into 2024. The vessels are mainly expected to be added to the Asia lanes, which will further widen the gap between capacity and demand.
- Temporary China barge suspension will occur again during Q1 2024 prior to Chinese Lunar New Year from February 5 to February 18, 2024. As usual during the barge suspension period, customers will need to terminate shipments bound for Pearl River Delta ports at the China base ports called directly by ocean carriers, such as Hong Kong and Yantian.
U.S.–Europe
- Demand continues to be low, particularly on the Trans-Atlantic westbound (TAWB) lane, which has created significant overcapacity on the trade from USEC to Europe.
- Some carriers have taken steps to address overcapacity by reducing the size of vessels operating on certain service strings between USEC and Europe. Even with these adjustments, it will not be sufficient to prevent continued overcapacity. There are no significant blank sailings or cancelled service strings planned at this time.
- Space is still tight (e.g., USWC to Europe) due to lack of sailing options. Carriers are substantially booked on the all-water services (e.g., Los Angeles and Oakland).
- Space, namely from U.S. Gulf Coast (USGC) ports to Europe, has improved since early 2023. Carriers are not likely to pull capacity in the short term due to strong vessel space utilization rates.
- Continued low water levels at the Rhine River are affecting barge transports due to draft restrictions. Since October 2023, a pass-through low water surcharge from carriers has been assessed for both import and export cargo.
U.S.–LATAM
- Peak season in this lane means carriers are implementing PSS surcharges during Q4 2023. Carriers are further announcing planned general rate increases (GRIs) for shipments to the Caribbean in early 2024.
- Space is improving to East Coast South America (ECSA) ports, especially from USEC and USGC ports.
- Space, namely USEC and USGC to West Coast South America (WCSA) ports has been significantly improving.
- Carriers are also improving their vessel space capacity being offered (e.g., USWC ports to ECSA and WCSA ports).
U.S.–Oceania
- As peak season progresses, space is tighter for USEC and also USWC due to citrus season. Recommend booking 2–3 weeks in advance.
- Transshipment options to Oceania are open with plenty of capacity available, especially at USWC ports.
- The Brown Marmorated Stink Bug (BMSB) fumigation season is in effect for all vessels departing from the United States effective September 1, 2023, and will be in effect through May 2024.
- Labor at the DP World terminals are taking industrial action at ports across Australia as a pressure tactic while they negotiate their new contract. They are engaging in disruptive job actions at Brisbane, Sydney, Melbourne, and Fremantle ports. The job actions are rotating from port to port and cause slowdowns and partial closures, while avoiding an outright strike. These jobs actions are creating some congestion.
U.S.–SAMA
- Space is improving in general, especially with several carriers announcing they are re-opening space and service into this market. However, stay aware of pockets where space is tight and regular blank sailings still occur.
- Space is most readily available (e.g., U.S. Northeast ports of NY and Norfolk) where there are more direct services.
- Space, namely at USGC ports, continues to be very tight, but has improved slightly with the reinstatement by CMA and COSCO of their MedGulf service (e.g., USGC Miami and Houston ports). This service provides connections from USGC ports to ISC destinations, adding a needed additional carrier option.
- South Africa ports are severely congested currently due to the historic flooding that destabilized the port infrastructure, followed by severe reductions in productivity at the ports. They are handling more cargo than the port terminals can efficiently handle so vessels are dwelling up to 19–20 days at Durban port and 6–7 days at Port Elizabeth. Ocean carriers have announced port congestion surcharges effective in early December 2023 to help address the costs incurred.
- Cyclone Michaung hit southern India ports in early December and suspended port services in Chennai, Kattupalli, and Ennore for three days due to torrential rains and flooding.
- Recent piracy attacks in the Red Sea may prompt carriers to introduce war risk surcharges for shipments routed through the Suez Canal if the conflict in the Middle East persists and these acts of piracy persist.
- Demand continues to be soft. Vessel capacity far exceeds demand.
- Carriers continue their blank sailings, slow steaming, and sliding schedules to better align capacity with demand. It’s estimated that up to 9% of sailings have been blanked over the last quarter.
- In the first 10 months of 2023, approximately 1.5 million TEUs of new vessel capacity has been added to the global container fleet, representing a 6% increase. There will be another 2.4 million TEUs of vessel capacity slated for delivery in 2024. Most of the largest vessels would normally enter the Asia–Europe lane. Carriers are advising if market conditions do not improve, they may lay up the new vessels, not bringing them into service until demand improves.
The Trans-Tasman market has continued to soften. Space and equipment availability is still widely open. Rates are being reviewed regularly with the introduction of new options in this trade lane.
Direct carrier space is stabilizing from the USEC and continues to be open off the USWC while trans-shipment service options are widely available. Rates have stabilized with supply versus demand being okay.
The Europe to Oceania market continues to see direct carriers trying to hold market share. Rates are revised in small increments as supply continues to outweigh demand, with space and equipment readily available for dry cargo.
Northeast Asia supply continues to tighten as carriers increase blank sailing/port omissions, while demand remains steady from Southeast Asia to Oceania. General Rate Increases (GRIs) are being implemented from Northeast Asia to Australia, Australian East Coast ports, and New Zealand.
Export rates are under pressure. Wastepaper, grain, wool, and cotton/cotton seed are still moving in large numbers with load factors strong for the next month but is coming up against constant competition and rate pressure. It is difficult to forecast 20' GP/food quality capacity for Melbourne and Adelaide during solid grain season.
Feeder space to ISC is tight across most carriers with small allocations against demand from Singapore.
In South Asia, across various trade routes, market conditions are stable with relatively open capacity and low spot market rates. However, tight space and increasing rates in Pakistan are notable due to the ongoing mango season, while potential disruptions in the Middle East, particularly in Israel, may impact services in that region.
In the Middle East, overall market conditions are strained, marked by tight capacity and mid-level spot market rates, particularly from the Gulf, with potential service disruptions due to the conflict in Israel. However, there is a trend of decreasing rates and available space out of Turkey, providing some relief in certain trade routes.
In African trade routes, market conditions vary, with generally stable conditions in Asia and Oceania, but strains in routes to Europe and North America due to tight capacity and mid-level spot market rates. Notably, North Africa rates are consistently up. Recommend booking in advance for certain regions, while conflicts in the Middle East and holiday seasons impact rates and space availability.
Inland Drayage Update
The domestic transportation market is stronger with the arrival of the traditional peak season. Freight rates are experiencing a brief rebound compared to third quarter. The transportation market is expected to hold steady until the end of 2023. However, due to the decline in overall demand compared to last year, trucking capacity is still in a surplus state and asset-heavy transport fleets are under pressure to feed drivers and vehicles.
Transit time at Pingxiang port from China to Southeast Asia is around 3–4 days as there is a volatile rise of the cross-border trucking demand. Meanwhile, there is no congestion for import trucking from Southeast Asia to China after fruit season.
A CO2 emissions tax of €200 per ton in road tolls for heavy good vehicles began on December 1, 2023, under an agreement by the ruling of the German Federal Ministry of Transport and Digital Infrastructure.
This increase impacts all cargo movements carried out by vehicles over 7.5 tons, such as:
- Pre- and on-carriage for container transportation
- Full truck load movements within Germany
- Groupage/part-load movements within Germany
- International transport where Germany is a transit country (e.g., Austria to Holland)
Atlanta
- The market is experiencing growth but also facing major challenges related to capacity constraint and driver shortages.
- Ongoing infrastructure improvements and sustainability initiatives are expected to drive further development and efficiency in this vital market.
- Many carriers are actively adopting greener practices to minimize emissions, like alternative fuel, electric vehicles (EVs), and route planning optimization.
Savannah
- Carriers are pushing to increase their fleets and enticing drivers into their ranks to prepare for first quarter 2024.
- The driver shortage has led to increased competition with brokers and asset-based carriers, so there is the potential for rate increases in the new year to help support these incentives.
Charleston
- Palmetto Railways, a division of the South Carolina Department of Commerce, has been awarded a large grant to procure and retrofit two zero-emissions lithium battery electric-powered locomotives.
- This project will reduce diesel and greenhouse gas emissions, as well as improve overall safety. This is an exciting upgrade as green options have become more desirable.
Minneapolis/Omaha/Chippewa Falls/St. Louis/Kansas City
- One of the biggest stresses carriers face is having enough work to keep all drivers and staff busy and employed, while not knowing how long the valley (slow volume time) will last.
- Retaining drivers and their ability to earn income during the downturn is paramount for loyalty, overall satisfaction, and ultimately longevity for carrier growth goals.
- Due to current market conditions, carriers are adjusting approaches with drivers. They are encouraging flexibility in accepting dispatches for various drayage moves they may not have accepted in the past. They aim to utilize those available expansion opportunities and various move types (i.e., hauling intermodal containers, long haul, or overweight) , which is expected to continue even when the market improves.
Houston
- The Port of Houston terminals, Turning Basin, Babours Cut, and Bayport, announced a 3.2% increase in tariff charges, including dockage, wharfage, throughput charges, container storage rates, container crane and private crane rental rates, water hookup rates, freight handling rates, and other miscellaneous charges with an effective date of January 1, 2024.
- Larger loads, aging roads, and a dwindling population of carriers willing to haul extremely overweight containers out of Houston and other southern ports is cutting into capacity, making it difficult to obtain government permits for excessive overweight shipments.
- Routing for oversized/overweight shipments to meet local and state permitting requirements have caused transit time delays and can sometimes result in more miles and longer trips. For heavy-haul transport companies, longer trips also means additional expenses for reworking arrangements for escort vehicles, spare tire trucks, and drivers. The old standard of a single flat overweight fee is no longer the norm in some markets.
LA/LB ports
- Drivers at the ports of Los Angeles and Long Beach report chronic problems securing appointment slots for container moves, which is particularly frustrating now when there’s little to no congestion at the gateway’s marine terminals.
- To help relieve some of frustrations, the Harbor Trucking Association and Yusen Terminals agreed to a pilot project that will shorten the window for receiving containers. This will allow for more appointment slots during the day, potentially reducing driver wait time in the port.
- It has been confirmed that the ITS terminal in Long Beach will remain open, however they are not accepting any vessels until further notice.
- Empty stop offs—there is an increase in empty stop offs.
- Limited return appointments are causing drivers to return the container to their yard.
- C.H. Robinson is reviewing carriers with more stops offs than others, looking for trends, and addressing on an individual basis.
- Carriers are required to provide backup for any additional charges that occur.
- Pier Pass charges increased starting November 1, 2024:
- 40 ft. = $71.14
- 20 ft. = $35.57
The contract between union labor and the port of Montréal authority expires on December 31, 2023. Contract talks have begun. Based on initial reports, the two sides are far apart. If there is any disruption to the port of Montréal operations due to these negotiations, anticipate significant cargo diversion to the USEC and Halifax/Saint John ports.
Australian port logistics and landside container transport services are operating at below optimum levels due to the ongoing Planned Industrial Action at DP World Terminals across Australia.
Work bans and stoppages are scheduled to continue throughout the month of December impacting Brisbane, Sydney, Melbourne, and Fremantle terminals. Monitor the situation and look for updates via C.H. Robinson Client Advisories.
Customs Update
Visit our Trade & Tariff Insights page for the latest news, insights, perspectives, and resources from our customs and trade policy experts.
Australia is experiencing delays with the processing of quarantine entries and longer delays where cargo inspections are required. In New Zealand, customs and processing times are currently operating at levels within capacity with no reported delays.
As a reminder, The Department of Agriculture, Forest and Fisheries, Canberra Office will close from close of business Friday, December 22, 2023, and will re-open at the commencement of business on Tuesday, January 2, 2024.
U.S. Tariff Search Tool
Stay up to date with client advisories
Receive notices on changing regulations when they happen.
Customize and download this report
Shipping lane updates
Use this tool to forecast how capacity and rate trends impact your business. Create customized, shareable reports by adding your preferred trade lanes. Ocean and air shipping routes are updated on the third Thursday of each month.
Market status key:
Stable
Strained
Critical
Trending up
Trending down
Flat
Add a trade lane
Trade lane {origin} to {destination} is not available.
Trade lane {origin} to {destination} is already listed.
Africa to Asia
Ocean freight market update


Capacity
Spot rates
- this is my comment, there are many like it but this one is mine
- what comment one said, here here!
Air freight market update
Capacity
Spot rates
- comment one baby!
- comment two dude!
Africa to Europe
Ocean freight market update
Capacity
Spot rates
- West and North Africa rates, space, and schedules are heavily impacted by Red Sea disruptions
- South Africa is less impacted, but still has heavy port congestion and vessel omissions
Air freight market update
Capacity
Spot rates
- Demand and capacity are relatively balanced
Africa to Latin America
Ocean freight market update

Capacity
Spot rates
- West and North Africa rates, space, and schedules are heavily impacted by Red Sea disruptions
- South Africa is less impacted, but still has heavy port congestion and high rates
Air freight market update
Capacity
Spot rates
- Demand and capacity are relatively balanced
Africa to Middle East
Ocean freight market update
Capacity
Spot rates
- West and North Africa rates, space, and schedules are heavily impacted by Red Sea disruptions
- South Africa is less impacted, but still has heavy port congestion
Air freight market update
Capacity
Spot rates
- Demand and capacity are relatively balanced
Africa to North America
Ocean freight market update
Capacity
Spot rates
- West and North Africa rates, space, and schedules are heavily impacted by Red Sea disruptions
- South Africa services have Cape Town omissions, long transit times, and high rates
Air freight market update
Capacity
Spot rates
- Demand and capacity are relatively balanced
- Some capacity challenges remain in South Africa
Africa to Oceania
Ocean freight market update
Capacity
Spot rates
- Work stoppages at Australia's DP World’s terminals ceased, but expect slow recovery
- With Suez Canal route compromised, global space challenges, capacity shifts, and blank sailing affect this lane
Air freight market update
Capacity
Spot rates
- Demand and capacity are relatively balanced
Africa to South Asia
Ocean freight market update
Capacity
Spot rates
- West and North Africa rates, space, and schedules are heavily impacted by Red Sea disruptions
- South Africa is less impacted, but still has heavy port congestion
Air freight market update
Capacity
Spot rates
- Demand and capacity are relatively balanced
Asia to Africa
Ocean freight market update
Capacity
Spot rates
- Congestion in South Africa continues
- Suez Canal limited access puts pressure on North Africa destinations; potential equipment shortage upcoming
Air freight market update
Capacity
Spot rates
- Stable market conditions as demand trends down following the Lunar New Year
- Red Sea crisis could shift demand to air, resulting in increased rates
Asia to Europe
Ocean freight market update
Capacity
Spot rates
- Rates are trending down due to Lunar New Year Holiday
- Suez Canal route compromised; tight space as capacity is absorbed by longer Cape of Good Hope route
Air freight market update
Capacity
Spot rates
- Demand expected to be mild after the Lunar New Year; flight cancelations will be common in mid-February
- Red Sea crisis could shift demand to air, resulting in increased rates
Asia to Latin America
Ocean freight market update
Capacity
Spot rates
- 30% capacity reduction; rate increases expected; potential equipment shortage upcoming
- With Suez Canal route compromised, global space challenges/shifts may affect this lane
Air freight market update
Capacity
Spot rates
- Stable market conditions as demand trends down following the Lunar New Year
Asia to Middle East
Ocean freight market update
Capacity
Spot rates
- Rate increases expected; potential equipment shortage upcoming
- With Suez Canal route compromised, global space challenges/shifts may affect this lane
Air freight market update
Capacity
Spot rates
- Stable market conditions as demand trends down following the Lunar New Year
- Red Sea crisis could shift demand to air, resulting in increased rates
Asia to North America
Ocean freight market update
Capacity
Spot rates
- Spot rates trending slightly down after initial February 1 increase; capacity dropped 40-50% due to Lunar New Year
- Expect space challenges and potential equipment shortage
Air freight market update
Capacity
Spot rates
- Demand expected to be mild after the Lunar New Year; flight cancelations will be common in mid-February
- Red Sea crisis could shift demand to air, resulting in increased rates
Asia to Oceania
Ocean freight market update
Capacity
Spot rates
- Work stoppages at Australia's DP World’s terminals ceased, but expect slow recovery
- With Suez Canal route compromised, global space challenges, capacity shifts, and blank sailing affect this lane
Air freight market update
Capacity
Spot rates
- Stable market conditions as demand trends down following the Lunar New Year
Asia to South Asia
Ocean freight market update
Capacity
Spot rates
- Expect equipment shortage to push rates up
- With Suez Canal route compromised, global space challenges/shifts may affect this lane
Air freight market update
Capacity
Spot rates
- Stable market conditions as demand trends down following the Lunar New Year
Europe to Africa
Ocean freight market update
Capacity
Spot rates
- Services and rates are affected by Red Sea disruptions
- Equipment availability challenges, particularly at inland depots
Air freight market update
Capacity
Spot rates
- Capacity and rates are stable month over month
Europe to Asia
Ocean freight market update
Capacity
Spot rates
- Suez Canal route compromised; tight space due to unreliable schedules/blank sailings out of MED; NEUR less impacted
- Equipment availability challenges, particularly at inland depots
Air freight market update
Capacity
Spot rates
- Demand will determine upcoming spot rates as capacity reductions have brought more balance to the market
- Tight conditions after Lunar New Year as shippers attempt to time arrivals as soon as companies re-open
Europe to Latin America
Ocean freight market update
Capacity
Spot rates
- Suez Canal route compromised; expect potential effect on rates in the future
- Equipment availability challenges, particularly at inland depots
Air freight market update
Capacity
Spot rates
- Overall stable market, with a balance of capacity and demand
Europe to Middle East
Ocean freight market update
Capacity
Spot rates
- Suez Canal route compromised; tight space due to unreliable schedules/blank sailings out of MED; NEUR less impacted
- Equipment availability challenges, particularly at inland depots; Aqaba and Jeddah port calls suspended by some liners
Air freight market update
Capacity
Spot rates
- Overall stable market
Europe to North America
Ocean freight market update
Capacity
Spot rates
- With Suez Canal route compromised, global space challenges/shifts may affect this lane
- Equipment availability challenges, particularly at inland depots; carriers announced various rate increases
Air freight market update
Capacity
Spot rates
- Demand will determine upcoming spot rates as capacity reductions have brought more balance to the market
- Labor actions contribute to market instability in early February
Europe to Oceania
Ocean freight market update
Capacity
Spot rates
- Due to Red Sea disruptions, rates are trending up, but space is still manageable
- With Suez Canal route compromised, global space challenges, capacity shifts, and blank sailing affect this lane
Air freight market update
Capacity
Spot rates
- Overall stable with access to capacity and medium level rates
Europe to South Asia
Ocean freight market update
Capacity
Spot rates
- Suez Canal route compromised; tight space due to unreliable schedules/blank sailings out of MED; NEUR less impacted
- Equipment availability challenges, particularly at inland depots
Air freight market update
Capacity
Spot rates
- Capacity and rates are stable
Latin America to Africa
Ocean freight market update
Capacity
Spot rates
- Africa port congestion continues due to Red Sea disruptions; carriers apply port congestion surcharges
- Services that are also calling North Europe have less space
Air freight market update
Capacity
Spot rates
- Options are limited and require connections via Europe or Middle East
Latin America to Asia
Ocean freight market update
Capacity
Spot rates
- Rates are stable
- Equipment shortage out of Columbia and Chile
Air freight market update
Capacity
Spot rates
- Reduction in capacity in overall market due to end of fruit season out of Chile.
Latin America to Europe
Ocean freight market update
Capacity
Spot rates
- Main volume destination for Latin America; Panama Canal low water restrictions and surcharges
- Suez Canal route compromised; tight space as capacity is absorbed by longer Cape of Good Hope route
Air freight market update
Capacity
Spot rates
- End of flower season will release available space, however carriers will also adjust capacity
Latin America to Middle East
Ocean freight market update
Capacity
Spot rates
- Rates are generally stable but space is volatile due to congestion in some destination ports
- Congestion at Mediterranean ports continues due to Red Sea disruptions, carriers apply congestion surcharges
Air freight market update
Capacity
Spot rates
- Middle East carriers offer capacity for perishable customers; reduced availability for general cargo
Latin America to North America
Ocean freight market update
Capacity
Spot rates
- Main volume destination for Latin America
- Rates are mostly stable aside from Panama Canal surcharges
Air freight market update
Capacity
Spot rates
- End of flower season will release available space, however carriers will also adjust capacity
Latin America to Oceania
Ocean freight market update
Capacity
Spot rates
- This lane is stable; equipment shortage out of Columbia
- With Suez Canal route compromised, global space challenges, capacity shifts, and blank sailing affect this lane
Air freight market update
Capacity
Spot rates
- Options are limited and require connections via Europe or Middle East
Latin America to South Asia
Ocean freight market update
Capacity
Spot rates
- Rates are mostly trending flat to down; carriers look to reposition container equipment back to India
- 20ST container shortage out of Peru and Chile
Air freight market update
Capacity
Spot rates
- Options are limited and require connections via Europe or Middle East
Middle East to Africa
Ocean freight market update
Capacity
Spot rates
- High rates still out of the Gulf; Turkey rates and space are less impacted
- With Suez Canal route compromised, global space challenges, capacity shifts, and blank sailing affect this lane
Air freight market update
Capacity
Spot rates
- Israel is the exception to the mentioned market conditions
- The conflict in Israel has resulted in many airlines canceling flights and high spot market rates
Middle East to Asia
Ocean freight market update
Capacity
Spot rates
- Rates are high, but space is manageable for the most part
- With Suez Canal route compromised, global space challenges, capacity shifts, and blank sailing affect this lane
Air freight market update
Capacity
Spot rates
- Israel is the exception to the mentioned market conditions
- The conflict in Israel has resulted in many airlines canceling flights and high spot market rates
Middle East to Europe
Ocean freight market update
Capacity
Spot rates
- With Suez Canal route compromised, global space challenges, capacity shifts, and blank sailing affect this lane
- Tighter space out of the Gulf and high rates; this is one of the main volume destination from Middle East
Air freight market update
Capacity
Spot rates
- Israel is the exception to the mentioned market conditions
- The conflict in Israel has resulted in many airlines canceling flights and high spot market rates
Middle East to Latin America
Ocean freight market update
Capacity
Spot rates
- High rates and tight space out of the Gulf; Turkey rates and space are less impacted
- With Suez Canal route compromised, global space challenges, capacity shifts, and blank sailing affect this lane
Air freight market update
Capacity
Spot rates
- Israel is the exception to the mentioned market conditions
- The conflict in Israel has resulted in many airlines canceling flights and high spot market rates
Middle East to North America
Ocean freight market update
Capacity
Spot rates
- Tight space and high rates
- With Suez Canal route compromised, global space challenges, capacity shifts, and blank sailing affect this lane
Air freight market update
Capacity
Spot rates
- Israel is the exception to the mentioned market conditions
- The conflict in Israel has resulted in many airlines canceling flights and high spot market rates
Middle East to Oceania
Ocean freight market update
Capacity
Spot rates
- Tight space and higher rates; Australia's DP World’s terminals have resumed activity; expect slow recovery
- With Suez Canal route compromised, global space challenges, capacity shifts, and blank sailing affect this lane
Air freight market update
Capacity
Spot rates
- Israel is the exception to the mentioned market conditions
- The conflict in Israel has resulted in many airlines canceling flights and high spot market rates
Middle East to South Asia
Ocean freight market update
Capacity
Spot rates
- Rates are high, but space is manageable for the most part
- With Suez Canal route compromised, global space challenges, capacity shifts, and blank sailing affect this lane
Air freight market update
Capacity
Spot rates
- Israel is the exception to the mentioned market conditions
- The conflict in Israel has resulted in many airlines canceling flights and high spot market rates
North America to Africa
Ocean freight market update
Capacity
Spot rates
- Congestion at South Africa ports worsens, carriers charge port congestion surcharges
- Access to East Africa ports limited by rebel attacks in Gulf of Aden/Red Sea
Air freight market update
Capacity
Spot rates
- Capacity into Africa is stable
North America to Asia
Ocean freight market update
Capacity
Spot rates
- U.S. East Coast services shift routings via Suez Canal or Cape of Good Hope due to Panama Canal low water limitations
- Long transit times/blank sailings from East Coast; West Coast space may tighten as volumes shift from East Coast
Air freight market update
Capacity
Spot rates
- Annual aircraft maintenance in Q1 may impact capacity; overall demand expected to be light enough to remain stable
North America to Europe
Ocean freight market update
Capacity
Spot rates
- Significant vessel capacity on the U.S. East Coast is outstripping demand
- Stable U.S. Gulf and West Coast services; tight space (ex. West Coast); transit/costs impacted by Panama Canal limits
Air freight market update
Capacity
Spot rates
- Overall capacity is available, despite labor actions in Europe that have resulted in flight cancelations
North America to Latin America
Ocean freight market update
Capacity
Spot rates
- Carriers assigning Panama Canal surcharge where applicable; U.S. East and Gulf Coasts have space available
- U.S. West Coast services are indirect but space is mostly open despite Panama Canal limits
Air freight market update
Capacity
Spot rates
- Demand remains moderate, allowing easier access to capacity
North America to Middle East
Ocean freight market update
Capacity
Spot rates
- Limited service to Red Sea ports due to Houthi rebel attacks; longer transit times; high risk surcharges
- Better service available to Persian Gulf ports, but contingency surcharges and longer transit times apply
Air freight market update
Capacity
Spot rates
- Capacity into the Middle East remains stable
North America to Oceania
Ocean freight market update
Capacity
Spot rates
- Space open (ex U.S. East and West Coast) for direct services; port omissions in Oceania for schedule recovery
- With Suez Canal route compromised, global space challenges, capacity shifts, and blank sailing affect this lane
Air freight market update
Capacity
Spot rates
- Additional passenger flights continue to be added into the market, influencing pricing
North America to South Asia
Ocean freight market update
Capacity
Spot rates
- Increase in transit times/blank sailings via USEC/USGC due to conversion from Suez Canal to Cape of Good Hope
- Added capacity out of U.S. West Coast; yet space still extremely tight due to dried fruit, nuts, and harvest season
Air freight market update
Capacity
Spot rates
- The market is currently stable with limited movement on pricing
Oceania to Africa
Ocean freight market update
Capacity
Spot rates
- Capacity has increased; pricing is stable
- Work stoppages at Australia's DP World’s terminals ceased, but expect slow recovery
Air freight market update
Capacity
Spot rates
Oceania to Asia
Ocean freight market update
Capacity
Spot rates
- Service is back to normal; space and equipment are available
- Rates are trending down; work stoppages at Australia's DP World’s terminals ceased, but expect slow recovery
Air freight market update
Capacity
Spot rates
- Demand expected to increase on the Trans-Tasman market
Oceania to Europe
Ocean freight market update
Capacity
Spot rates
- Space is becoming more available; rates are stable
- Work stoppages at Australia's DP World’s terminals ceased, but expect slow recovery
Air freight market update
Capacity
Spot rates
- Ample capacity availability to most destinations
Oceania to Latin America
Ocean freight market update
Capacity
Spot rates
- Continued capacity control from carriers, as well as equipment repositioning continue to keep space tight
- Work stoppages at Australia's DP World’s terminals ceased, but expect slow recovery
Air freight market update
Capacity
Spot rates
Oceania to Middle East
Ocean freight market update
Capacity
Spot rates
- Equipment is available; work stoppages at Australia's DP World’s terminals ceased, but expect slow recovery
- Space is slowly opening; Suez Canal uncertainties may potentially disrupt services in the region
Air freight market update
Capacity
Spot rates
- Ample capacity availability to most destinations
Oceania to North America
Ocean freight market update
Capacity
Spot rates
- Space is available; rates are decreasing; Australia's DP World’s terminals resumed work; expect slow recovery
- With Suez Canal route compromised, global space challenges, capacity shifts, and blank sailing affect this lane
Air freight market update
Capacity
Spot rates
- Ample capacity availability to most destinations
Oceania to South Asia
Ocean freight market update
Capacity
Spot rates
- More carrier options have opened in the market; steamship lines continue to decrease rates to maintain filing factors
- Work stoppages at Australia's DP World’s terminals ceased, but expect slow recovery
Air freight market update
Capacity
Spot rates
- Ample capacity availability to most destinations
South Asia to Africa
Ocean freight market update
Capacity
Spot rates
- Space tight; rate increases out of all India origins; Carriers apply port congestion surcharges
- Suez Canal limited access puts pressure on North Africa destinations
Air freight market update
Capacity
Spot rates
- Increase in demand
South Asia to Asia
Ocean freight market update
Capacity
Spot rates
- Space is open and rates are stable to up out of India and Bangladesh
- Pakistan rates slightly up; space is relatively open
Air freight market update
Capacity
Spot rates
- Flat demand
South Asia to Europe
Ocean freight market update
Capacity
Spot rates
- Suez Canal route compromised; tight space as capacity is absorbed by longer Cape of Good Hope route
- Blank sailings and schedule unreliability; gape season adds pressure on space/refrigerated equipment
Air freight market update
Capacity
Spot rates
- Increase in demand from the airline hubs with transshipment cargo from China pushing prices up
South Asia to Latin America
Ocean freight market update
Capacity
Spot rates
- Suez Canal route compromised; tight space as capacity is absorbed by longer Cape of Good Hope route
- Blank sailings and schedule unreliability; liners are pushing market rate increases
Air freight market update
Capacity
Spot rates
- Capacity remains relatively low with limited options
- Lower cost options available via Miami
South Asia to Middle East
Ocean freight market update
Capacity
Spot rates
- Space is manageable; rates are slightly up out of India origins due to Suez Canal disruption
Air freight market update
Capacity
Spot rates
- Capacity is increasing as a result of new passenger flights
South Asia to North America
Ocean freight market update
Capacity
Spot rates
- Tight space as the Cape of Good Hope route absorbs capacity; some direct services shift to transshipment options
- With Suez Canal route compromised, global space challenges, capacity shifts, and blank sailing affect this lane
Air freight market update
Capacity
Spot rates
- Increase in demand from the airline hubs with transshipment cargo from China pushing prices up
South Asia to Oceania
Ocean freight market update
Capacity
Spot rates
- Space is tight and rates are up out of India and Bangladesh due to congestion at transshipment ports
- Some equipment shortage; Pakistan is less affected due to softer demand
Air freight market update
Capacity
Spot rates
- Delhi and Bangalore have new services
Trade lane FAQs
Q: What are C.H. Robinson's definitions of ‘stable,’ ‘strained,’ and ‘critical’?
Stable: Green – Relatively open capacity and low spot market rates
Strained: Yellow – Capacity is tight and mid-level spot market rates
Critical: Red – Backlog of capacity and high spot market rates
Q: What do the terms and acronyms commonly used in market updates mean?
- Blank sailings – Blank sailings occur when a carrier has removed a vessel rotation from a given service string. This results in one week where there is no vessel sailing offered at the ports called on that particular service string.
- CY – Container Yard. A location where containers are stored temporarily during transit. It can be a port terminal, rail terminal, or trucker’s yard.
- Extra loader – An extra loader is a vessel that an ocean carrier has added to a service string to increase capacity in the short term. This vessel would not be part of the standard vessel rotation on that service string. It would be removed as soon as it is no longer required to meet excess demand.
- FEU – Forty Foot Equivalent Unit. The forty foot represents a 40′ container.
- GRI – General Rate Increase. This is one of the mechanisms ocean carriers can use to increase rates for ocean transport on a particular trade.
- IPI – Interior Point Intermodal. Also known as rail ramps, these are inland points to/from which carriers can offer service on a through bill of lading.
- PSS – Peak Season Surcharge. This surcharge is typically applied by ocean carriers during the peak shipping period on a given trade lane, where vessel space is either fully utilized or overbooked.
- Roll/roll pools – A “roll“ happens when a container booked on a given sailing/vessel is transferred by the steamship line to the following vessel serving the requested lane. A “roll pool” is created when a steamship line plans for a large number of containers to roll from one vessel to another.
- SSL – Steamship line or ocean carrier
- Steamship line alliance – Alliances occur when a group of steamship lines share vessel space on their service strings and manage services in agreement with each other. There are currently three steamship line alliances on the main east-west trades: the Ocean Alliance, 2M Alliance, and The Alliance.
- TEU – Twenty Foot Equivalent Unit. The twenty foot represents a 20′ container.
- Transshipment – This service offered transports cargo in two legs on two different vessels. The first vessel brings the container from the port of origin to the port of transshipment. The second vessel brings the container from the port of transshipment to the final destination port.
- VSA – Vessel Sharing Agreement. This is an agreement between steamship lines to share slots (space) on a service string or vessel.
Market insight videos
Wheeled v. grounded U.S. inland terminals
Explore the difference between wheeled and grounded U.S. inland terminals with Jenna Kuehn, Director of Global Forwarding Inland at C.H. Robinson.
The chassis shortage
Learn about the dynamics behind equipment shortages in the U.S. inland market with Jenna Kuehn, Director of Global Forwarding Inland at C.H. Robinson.

Watch Oceania’s airfreight market forecast
Help minimize supply chain disruptors, while providing ways your supply chain can tackle the peak season. Included are key solutions you can adopt to lift the strain on your business and reduce the impact it can have on operations.
Get a free global freight forwarding consultation
Discover how our deep expertise and seamless, multimodal set of global services can help you realize potential ocean and air savings.